


US Indices Technical Outlook:
- S&P 500 declined into important slope support
- Dow also traded down to the Jan 2018 trend-line
- Nasdaq 100 pulling back to a lesser degree of support
See where our analysts see the stock market heading in the Q4 Equity Market Forecast.
S&P 500 declined into important slope support
The S&P 500 came off hard on Monday and then gapped lower yesterday after having put together an extremely persistent for the two-months prior. But how will the market respond from here? Yesterday’s gap down and reversal suggests there may be some short-term upside.
The reversal itself was of interest, but the fact that it came at an important long-term threshold is what gives it some real weight. The January 2018 trend-line crossing over highs in September 2018 and July of this year is viewed as a fairly significant line given its connecting points and influence over the summer.
If the market can hold onto yesterday’s low at 3070, or even if it trades a little beneath but still holds onto the slope from early 2018, then weakness may turn out to be one of the year’s last dips before completing a strong performing year.
If, however, a response from around current levels is lacking in power, then a weak attempt to quickly reverse losses could be indicating a decline of meaning has begun. A decline below the 2018 slope would quickly have 3025, the summer high, in focus, as well as the trend-line from December of last year and May of this year.
S&P 500 Daily Chart (Jan 2018 slope in play)

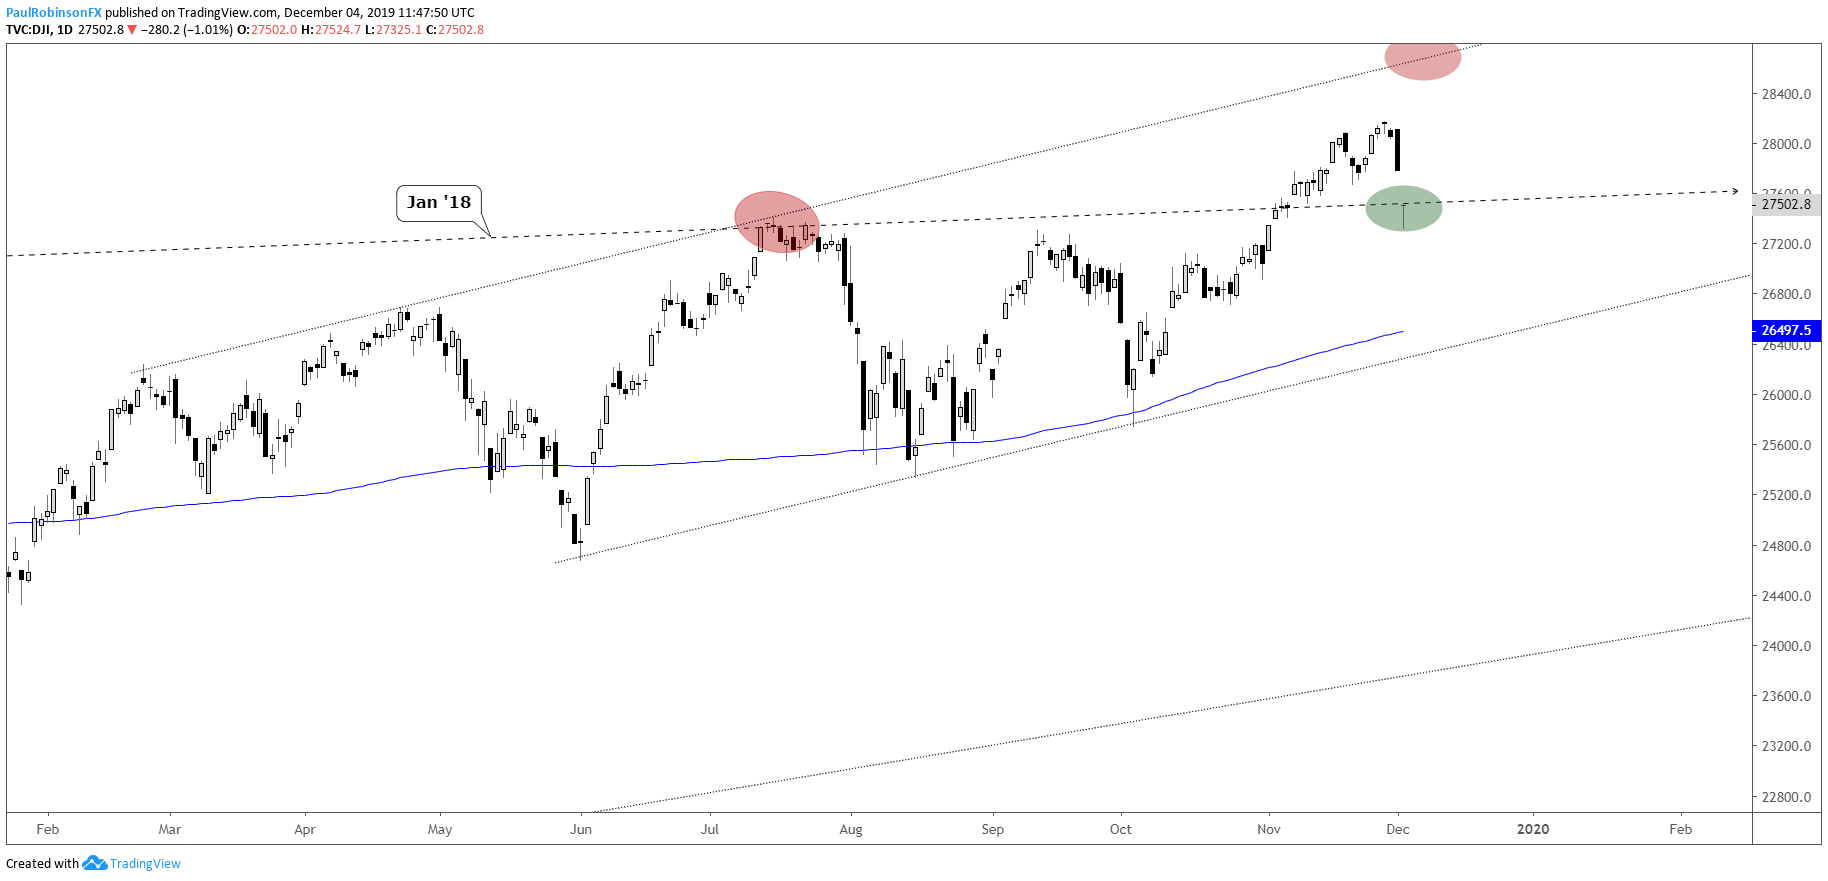
Dow also traded down to the Jan 2018 trend-line
The Dow Jones Industrial Average slipped just below the similar 2018 threshold as seen in the S&P 500. It did manage yesterday well to close off the lows, but the two losses were still rather significant given recent price action. How the market responds from here will be telling; pop back with force or put together a weak series of sessions where the market either moves sideways or worse. A failure to mount a quick recovery could set up the Dow for more losses should it continue to then drop below the January 2018 slope.
Dow Jones Daily Chart (2018 slope support)
Dow Jones Chart by TradingView
Check out the IG Client Sentiment page to see how retail traders are positioned and what it could potentially mean for various currencies and markets moving forward.
Nasdaq 100 holding up on a top-side trend-line
The Nasdaq 100 declined below the April slope making up the top crust of an ascending wedge, but did find support via the trend-line running over from September of last year, a line that also makes up the top part of an even larger wedge.
A decline below the Tuesday low at 8167 could have in play the trend-lines from December of last year and June of this year. A hold of support after gapping lower and thrusting higher, could lead to a new high or congestion phase if a run to end the year is in the cards. In wait-and-see mode at the moment.
Nasdaq 100 Daily Chart (Sep ’18 slope)

Nasdaq 100 Chart by TradingView
To learn more about U.S. indices, check out “The Difference between Dow, Nasdaq, and S&P 500: Major Facts & Opportunities.” You can join me every Wednesday at 1030 GMT for live analysis on equity indices and commodities, and for the remaining roster of live events, check out the webinar calendar.
Tools for Forex & CFD Traders
Whether you are a beginning or experienced trader, DailyFX has several resources available to help you; indicator for tracking trader sentiment, quarterly trading forecasts, analytical and educational webinars held daily, trading guides to help you improve trading performance, and one specifically for those who are new to forex.
---Written by Paul Robinson, Market Analyst
You can follow Paul on Twitter at @PaulRobinsonFX


