


U.S. Indices Technical Outlook:
- S&P 500 near record high, major top-side t-line
- Dow Jones same technical posturing as S&P
- Nasdaq 100 continues to fill out wedge formation
See how the quarterly forecast has played out what it could mean for the big-picture – Q3 Equity Markets Forecast.
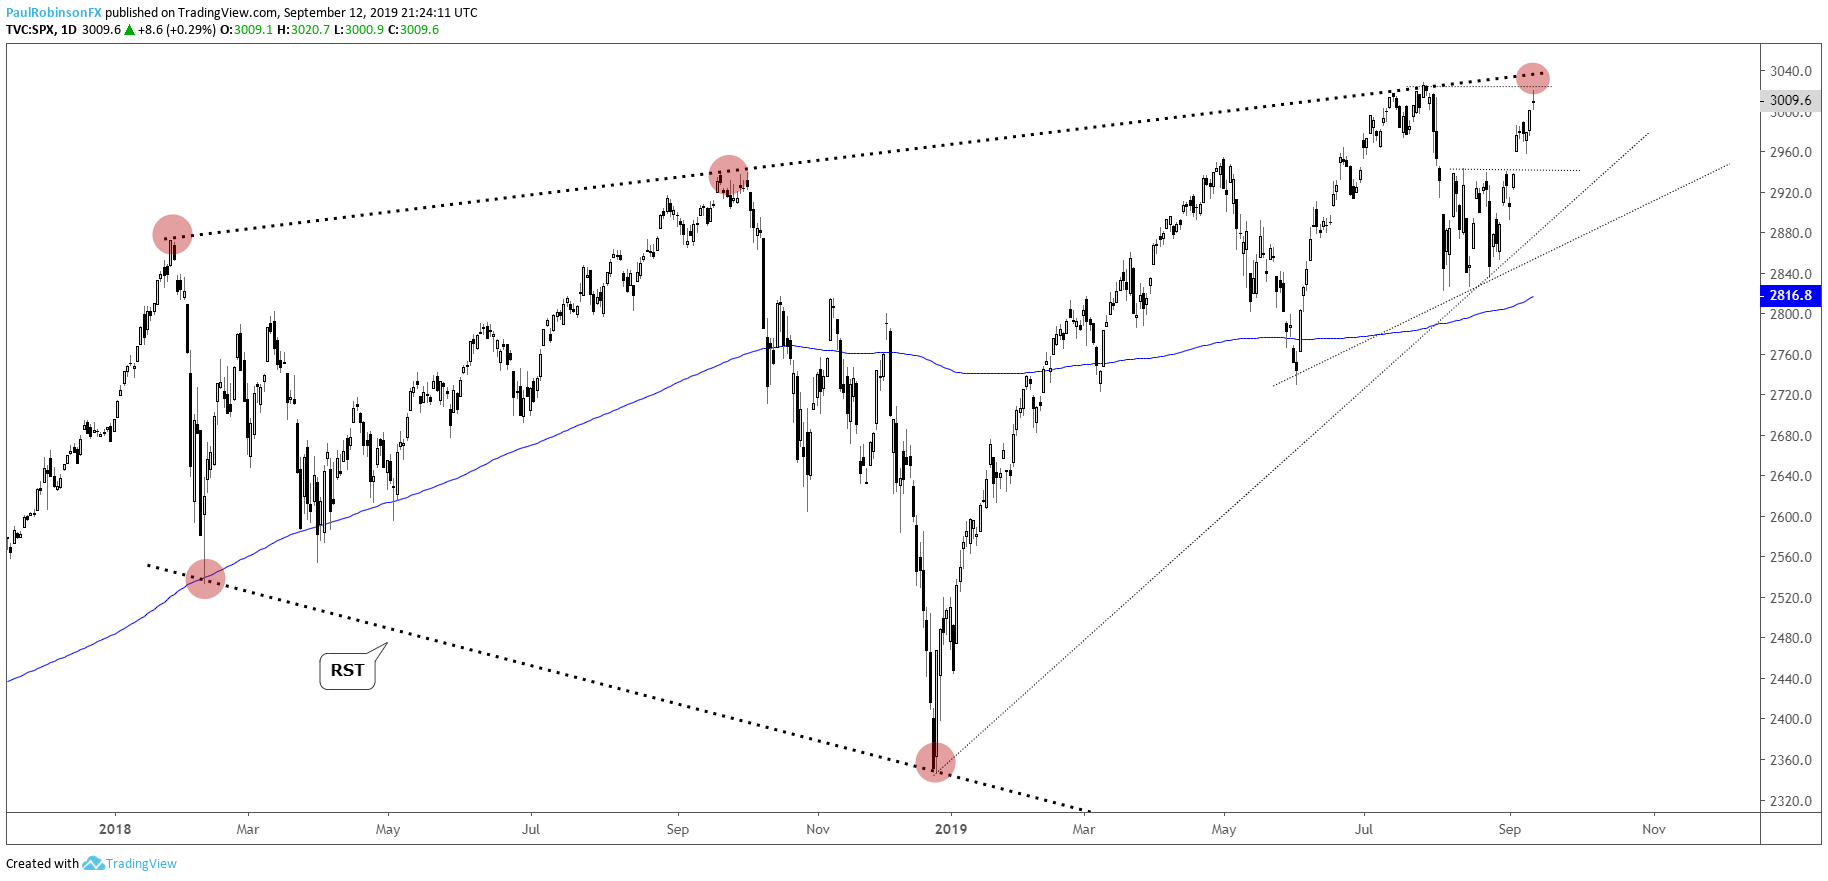
S&P 500 near record high, major top-side t-line
The S&P 500 broke out of a range last week and is positioned up against the prior record highs made earlier this summer. It hasn’t been the strongest move as of late, which is why the old record at 3028 coupled with the top-side trend-line from the January 2018 high may prove to be too much for the market to overcome for now.
A turn down looks to be nearing, how it unfolds will be the key to whether it could be a meaningful high or if the market wants to digest some of its recent gains before carrying on. Longer-term there is still the broad Reverse Symmetrical Triangle formation (RST) in play, with the Jan ’18 t-line making up the top of the pattern. Given its size the implications could be major later on should a top be confirmed on a breakdown in the months ahead.
Check out the IG Client Sentiment page to see how retail traders are positioned and what it could potentially mean for various currencies and markets moving forward.
S&P 500 Daily Chart (resistance just ahead)
Dow Jones same technical posturing as S&P
The Dow is up against the prior record high at 27398 and the same top-side trend-line from 2018 the SPX faces. Looking for a turn down here soon. How it unfolds will be telling, should one develop. No really visible support comes in until recent range levels around 26450 and then the trend-line off the December low.
Dow Jones Daily Chart (record, t-line resistance)
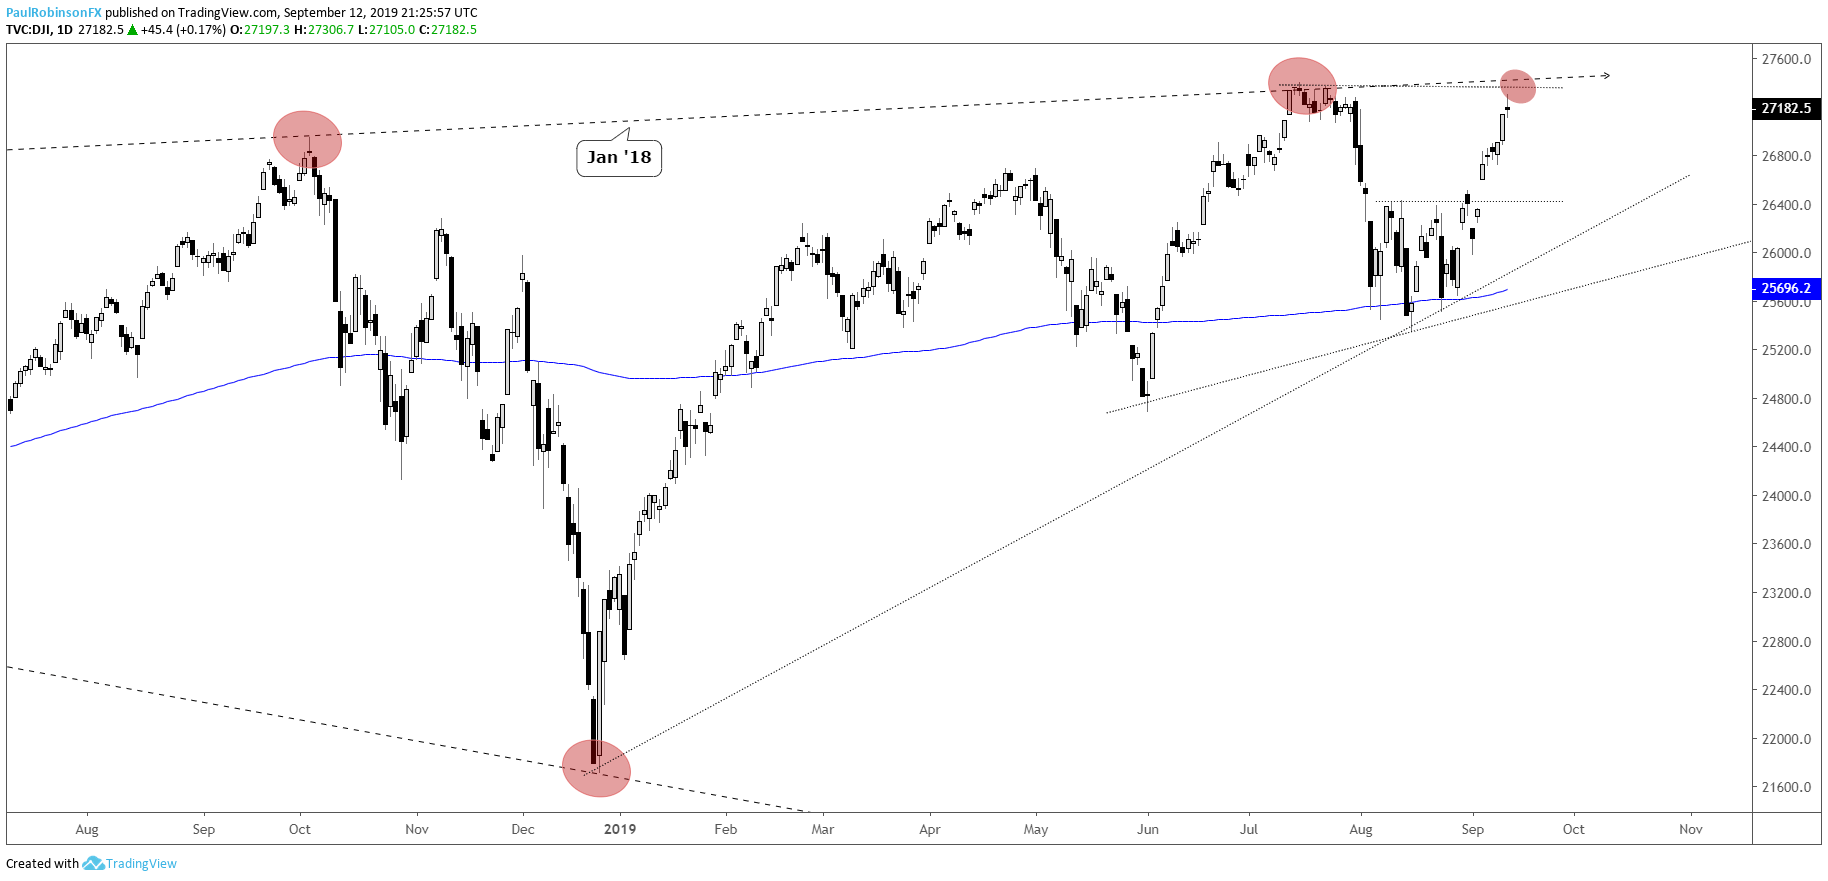
Dow Jones Chart by Tradingview
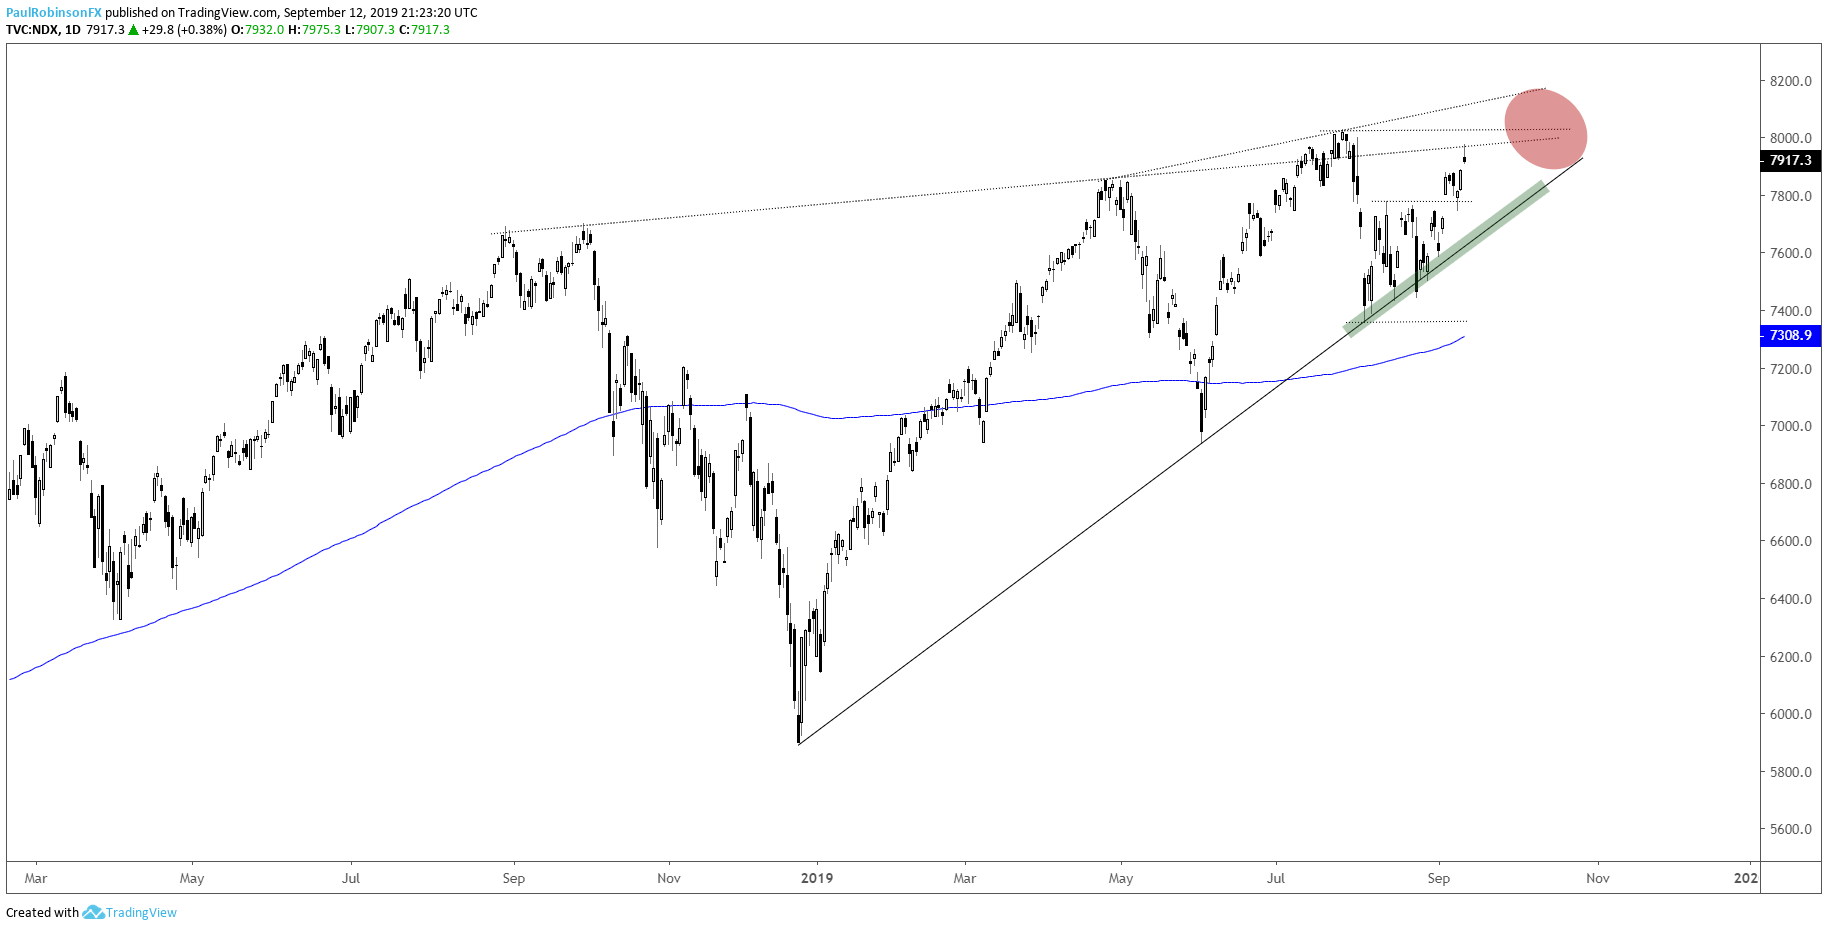
Nasdaq 100 continues to fill out wedge formation
The Nasdaq 100 is also near the old record high, but has a different set of patterns to watch. There is a large rising wedge visible, dating back to last year. The pattern, given its upward angle after a long bull market, suggests it could be a major topping formation, but until it breaks the underside trend-line the pattern won’t be officially triggered.
In the intermediate-term there is another smaller wedge building since the April high. The pattern and pattern situation make it a little tricky at the moment, but what is clear for now is that until the underside support line is broken the outlook is neutral at worst to bullish. We are quickly heading towards a major point potentially as the fall arrives and the patterns run out of real estate (red circle on chart).
Nasdaq 100 Daily Chart (large wedge(s) filling out)
Nasdaq 100 Chart by Tradingview
To learn more about U.S. indices, check out “The Difference between Dow, Nasdaq, and S&P 500: Major Facts & Opportunities.” You can join me every Wednesday at 10 GMT for live analysis on equity indices and commodities, and for the remaining roster of live events, check out the webinar calendar.
Tools for Forex & CFD Traders
Whether you are a beginning or experienced trader, DailyFX has several resources available to help you; indicator for tracking trader sentiment, quarterly trading forecasts, analytical and educational webinars held daily, trading guides to help you improve trading performance, and one specifically for those who are new to forex.
---Written by Paul Robinson, Market Analyst
You can follow Paul on Twitter at @PaulRobinsonFX


