


Dow Jones Forecast:
- The Dow Jones broke through the upper-bound of its August range, opening the door for a continuation higher
- While fundamental concerns linger, immediate risks have been pushed back to October when the US-China trade talks are reportedly scheduled
- Interested in trading the Dow Jones, Nasdaq or S&P 500? Read about the differences between them to learn the attributes of each
Dow Jones Outlook for the Week Ahead
The Dow Jones tagged its highest price since August 1 around 26,710 on Thursday after it was announced the US and China will meet to negotiate trade sometime in October. Although the meeting lacks a concrete date, markets were quick to latch onto the good news as evidenced by a battered VIX. The Dow Jones could look to continue higher if the resurgence in risk appetite is maintained. To that end, the Industrial Average lacks significant technical resistance prior to all-time highs from mid-July. With the uptick in volume that typically accompanies the Fall months, the conditions seem ripe for an attempt at new heights.
Dow Jones Price Chart: 4 – Hour Time Frame (June – September)

With that in mind, the Dow Jones must first surpass resistance around the 27,000 level. The round number stalled price briefly in July and could look to do so again in the coming days – albeit to a lesser degree than subsequent resistance around 27,400. Marking the Industrial Average’s all-time high, 27,400 will look to be the final point of resistance to a continuation higher which now enjoys robust technical support.
Check out our guide to Day Trading the Dow Jones Today.
Initial support is marked by the ascending trendline from December and June lows, residing around the 26,600 area. The trendline is succeeded by the upper-bound of the Dow’s recent range around 26,400. If the zone is broken, subsequent support would likely be offered by the various swing lows within the August range. While many traders are optimistic the Index will climb higher, retail trader data suggests not all are convinced.
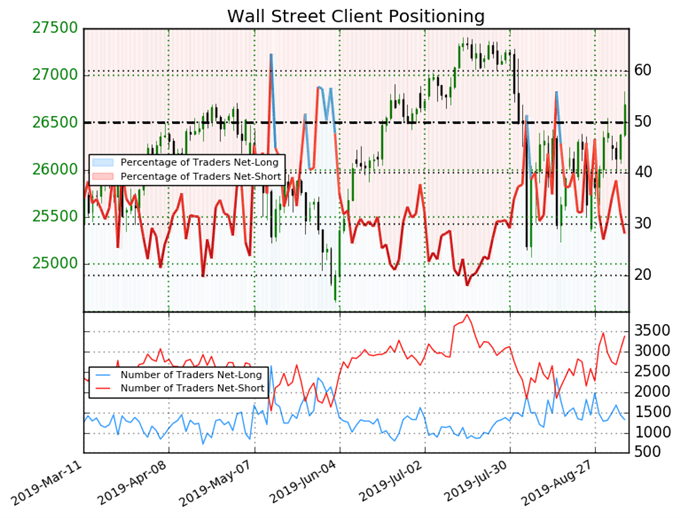
Retail trader data shows 28.1% of traders are net-long with the ratio of traders short to long at 2.55 to 1. In fact, traders have remained net-short since August 15 when Wall Street traded near 26331.3; price has moved 1.4% higher since then. The number of traders net-long is 20.9% lower than Wednesday and 6.8% lower from last week, while the number of traders net-short is 9.4% higher than Wednesday and 3.1% lower from last week.
We typically take a contrarian view to crowd sentiment, and the fact traders are net-short suggests Wall Street prices may continue to rise. In fact, due to the recent increase in shorts witnessed on Thursday, retail sentiment data delivers an even stronger bullish signal. While traders jockey for position on the Dow Jones, follow @PeterHanksFX on Twitter and look out for an ETF flows report on Friday.
--Written by Peter Hanks, Junior Analyst for DailyFX.com
Contact and follow Peter on Twitter @PeterHanksFX
Read more: Gold Price Forecast: XAU/USD ETF Holdings Continue to Buoy Outlook


