


LATEST US-CHINA TRADE WAR PROGRESS SINKS VOLATILITY & BOLSTERS RISK APPETITE
- The VIX Index plunged to a 2-week low as volatility crumbled while risk assets soared on news that the US and China scheduled trade talks for October
- Volatility may continue to decline and provide a positive headwind for trader sentiment so long as US-China trade war tensions ease and monetary policy actions match market expectations
- Check out IG Client Sentiment data for insight on trader positioning covering a wide range of markets like the S&P 500 Index, crude oil, USDJPY and more
An influx of market optimism following the latest US-China trade war development has sent the measures of volatility cratering (like the VIX Index) and risk assets flying (like the S&P 500 Index and crude oil). Traders celebrated reports out of Asia early Thursday that trade talks will be held between the US and China in early October. Shortly after, the positive shift in sentiment was propelled further by news that Hong Kong’s Carrie Lam officially withdrew the controversial extradition bill. Consequently, risk appetite has been spurred along now that two major market uncertainties are seemingly subsiding.
VIX INDEX PRICE CHART: DAILY TIME FRAME (DECEMBER 10, 2018 TO SEPTEMBER 05, 2019)
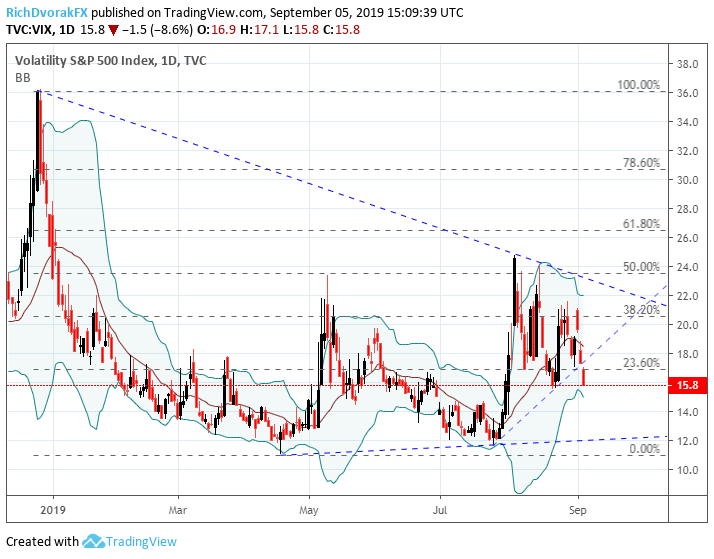
Chart created by @RichDvorakFX with TradingView
The VIX Index – Cboe’s 30-day implied volatility of the S&P 500 Index – took a huge blow in turn. Expected volatility measured via the VIX Index roughly quantifies the overall degree of market uncertainty or risk. As such, there is a strong inverse relationship between the S&P 500 Index and the VIX Index. That said, a large drop in gauges of volatility and jump in risk assets is to be expected with investors worrying less about an escalating US-China trade war and its impact on global GDP growth.
The latest nosedive in the VIX Index looks quite significant considering the massive gap printed below confluent support around the 17.00 price level and 23.6% Fibonacci retracement of its trading range since the December 2018 swing high. Also, the move to the downside also breached the short-term uptrend support line extended from July 25 and August 21 intraday lows. The VIX Index now searches for support near 15.50 which marks its August swing low.
VIX INDEX PRICE CHART: DAILY TIME FRAME (MARCH 22, 2019 TO SEPTEMBER 05, 2019)
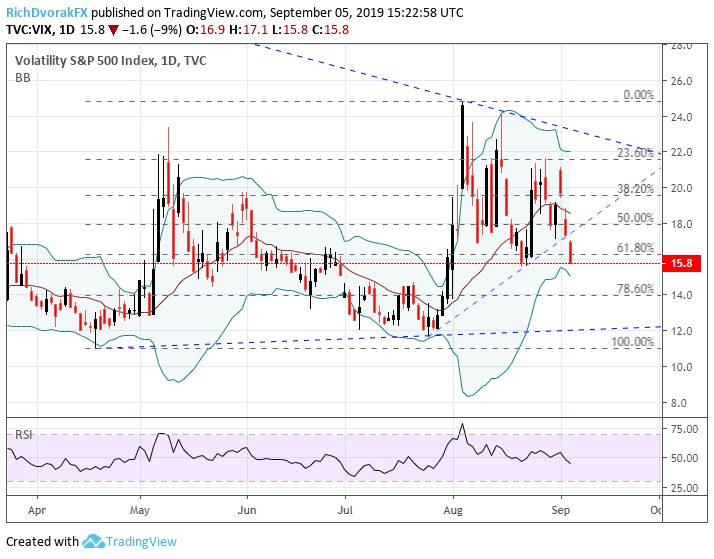
Chart created by @RichDvorakFX with TradingView
Taking a closer view, technical confluence around the 17.00 price level is also highlighted by the 61.8% Fib of the VIX Index’s ascent between mid-April and early August. Additionally, the significance of Thursday’s drop in volatility is also underscored by the RSI slipping below 50 and now appears to be trending lower. If the August swing low fails to provide buoyancy to the VIX Index, the next potential downside target could aim for the 14.00 price level which aligns closely with confluent support from its 78.6% Fib.
VOLATILITY PLUMMETS WHILE RISK APPETITE RESURFACES AS US-CHINA TRADE TENSIONS EASE
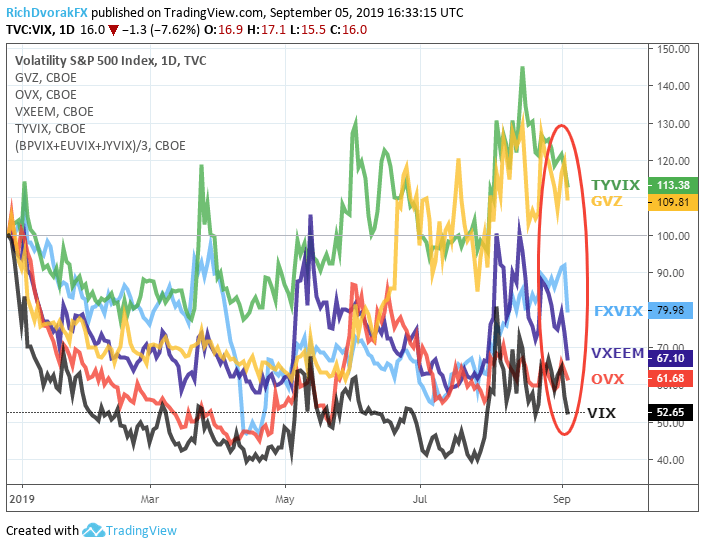
Chart created by @RichDvorakFX with TradingView
While the VIX Index may be the most popular measure of market risk and uncertainty, there are several other gauges that reflect expected volatility across a variety of asset classes – such as gold (GVZ), crude oil (OVX), emerging markets (VXEEM), US Treasuries (TYVIX) and currencies (FXVIX). Broadly speaking, the various volatility indices exhibit high degrees of correlation and tend to move in tandem with one another. This is evidenced by GVZ, OVX, VXEEM, TYVIX and FXVIX following VIX lower in response to Thursday’s news that China and US have scheduled trade talks for October.
EMERGING MARKETS CLIMB AS VXEEM WILTS
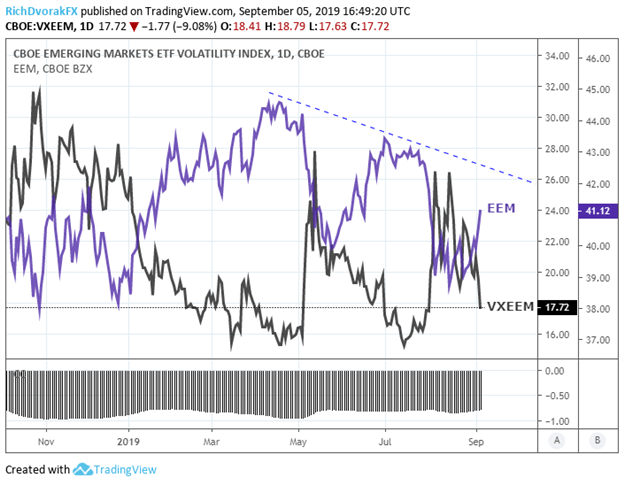
Chart created by @RichDvorakFX with TradingView
It is certainly worth keeping close tabs on VXEEM considering it reflects expected volatility of the EEM emerging markets ETF which has concentrated exposure to Chinese equities. We see that emerging markets volatility has cratered to its weakest reading since August 1 as EEM rises. With US-China trade tensions easing, VXEEM will likely continue to drift lower, which looks to provide a positive tailwind to emerging markets stock prices. Similarly, we have previously noted the relationship between VXEEM and spot USDCNH as a potential trade war barometer that can be used to gauge risk appetite.
CRUDE OIL PRICES BENEFIT FROM BOOST TO GLOBAL GDP GROWTH PROSPECTS
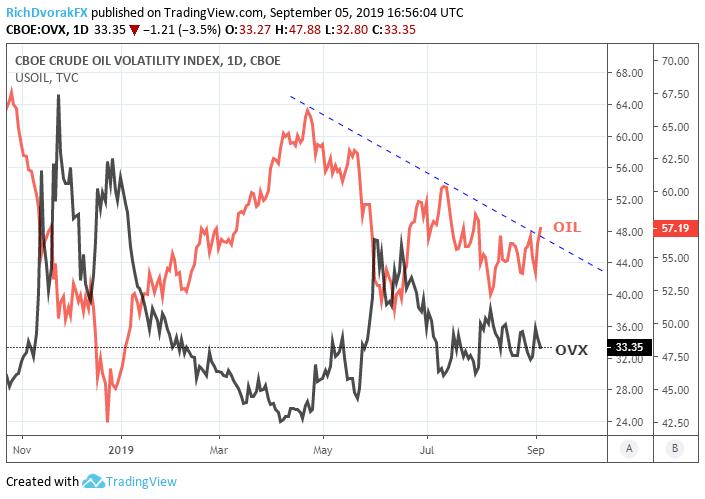
Chart created by @RichDvorakFX with TradingView
Looking across the realm of commodities, gold volatility and silver volatility have cratered alongside prices. However, precious metals like gold and silver behave differently to swings in volatility compared to the typical inverse relationship between volatility and risk assets like stocks. Rather, safe-havens like gold and silver generally hold a direct relationship with measures of volatility. As for oil, which is typically considered a “risky” asset seeing that crude oil prices tend to fall as sentiment sours and economic prospects deteriorate. Although, crude oil prices have gained as recession fears fade which is a trend likely to continue with volatility under pressure and hopes of US-China trade war progress. The rise in crude oil prices may also give a boost to commodity currencies that tend to benefit from higher oil prices and suppressed market volatility.
FOREX VOLATILITY RECEDES AND PROPS UP SPOT AUDJPY
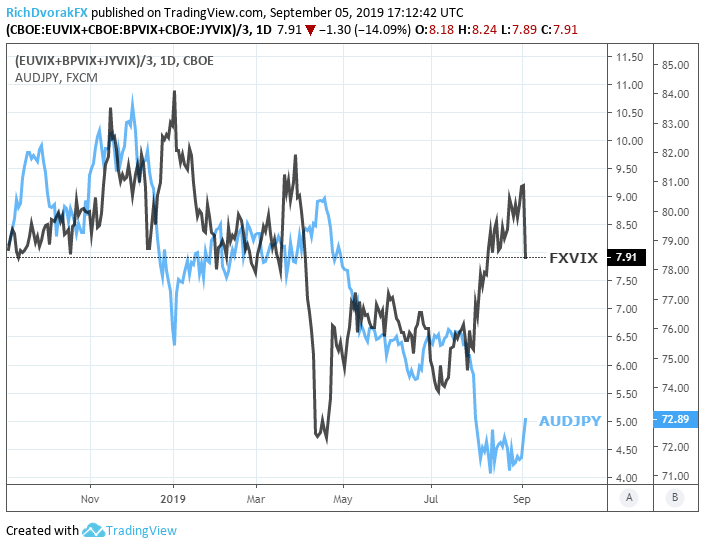
Chart created by @RichDvorakFX with TradingView
Further evidence of risk appetite resurfacing is the sharp rise in spot AUDJPY as forex volatility – measured by an equally weighed index of Cboe’s 30-day implied volatility readings on the Euro, Pound Sterling, and Japanese Yen – plummets. The fall in forex volatility boosts the relative attractiveness of carry trades and we have previously brought attention to the relationship between spot AUDJPY price action and risk assets. That said, spot AUDJPY may continue its recent ascent assuming volatility falls further as risk appetite grows.
-- Written by Rich Dvorak, Junior Analyst for DailyFX.com
Connect with @RichDvorakFX on Twitter for real-time market insight


