


S&P 500/Dow/Nasdaq 100 Technical Highlights:
- S&P 500 rising wedge teetering out of rising wedge
- Dow Jones downside leader at the moment
- Nasdaq 100 sitting at confluent support
Check out the fundamental and technical forecast for stocks as they rise towards record highs in the Q2 Equity Markets Forecast.
S&P 500 rising wedge teetering out of rising wedge
The rising wedge in the S&P 500 has been a focal point for the past couple of weeks, and with weakness in the past couple of sessions the index is edging outside the pattern. The break yesterday, though, wasn’t convincing as the market staged a minor rebound in the afternoon.
This leaves bearish price action to be desired, but could come soon, as it can take a little time once price breaches the underside trend-line of a rising wedge. We can use a break of the most recent swing-low or bottom of a consolidation pattern as a queue to look for momentum to pick up. In this case, a break below 2892.
A drop below there and the trading bias out of the wedge should turn decidedly bearish. The targeted objective would then become the 200-day MA at 2773 and bottom of the wedge down at 2722. If no trigger below 2892 develops, then a cross above the Wednesday high at 2954 will have the 3k psychological level and confluent trend-line crossing over from peaks set in 2018.
Traders are generally short the S&P 500, find out on the IG Client Sentiment page what this could be for prices moving forward.
S&P 500 Daily Chart (Rising wedge may soon trigger momentum)

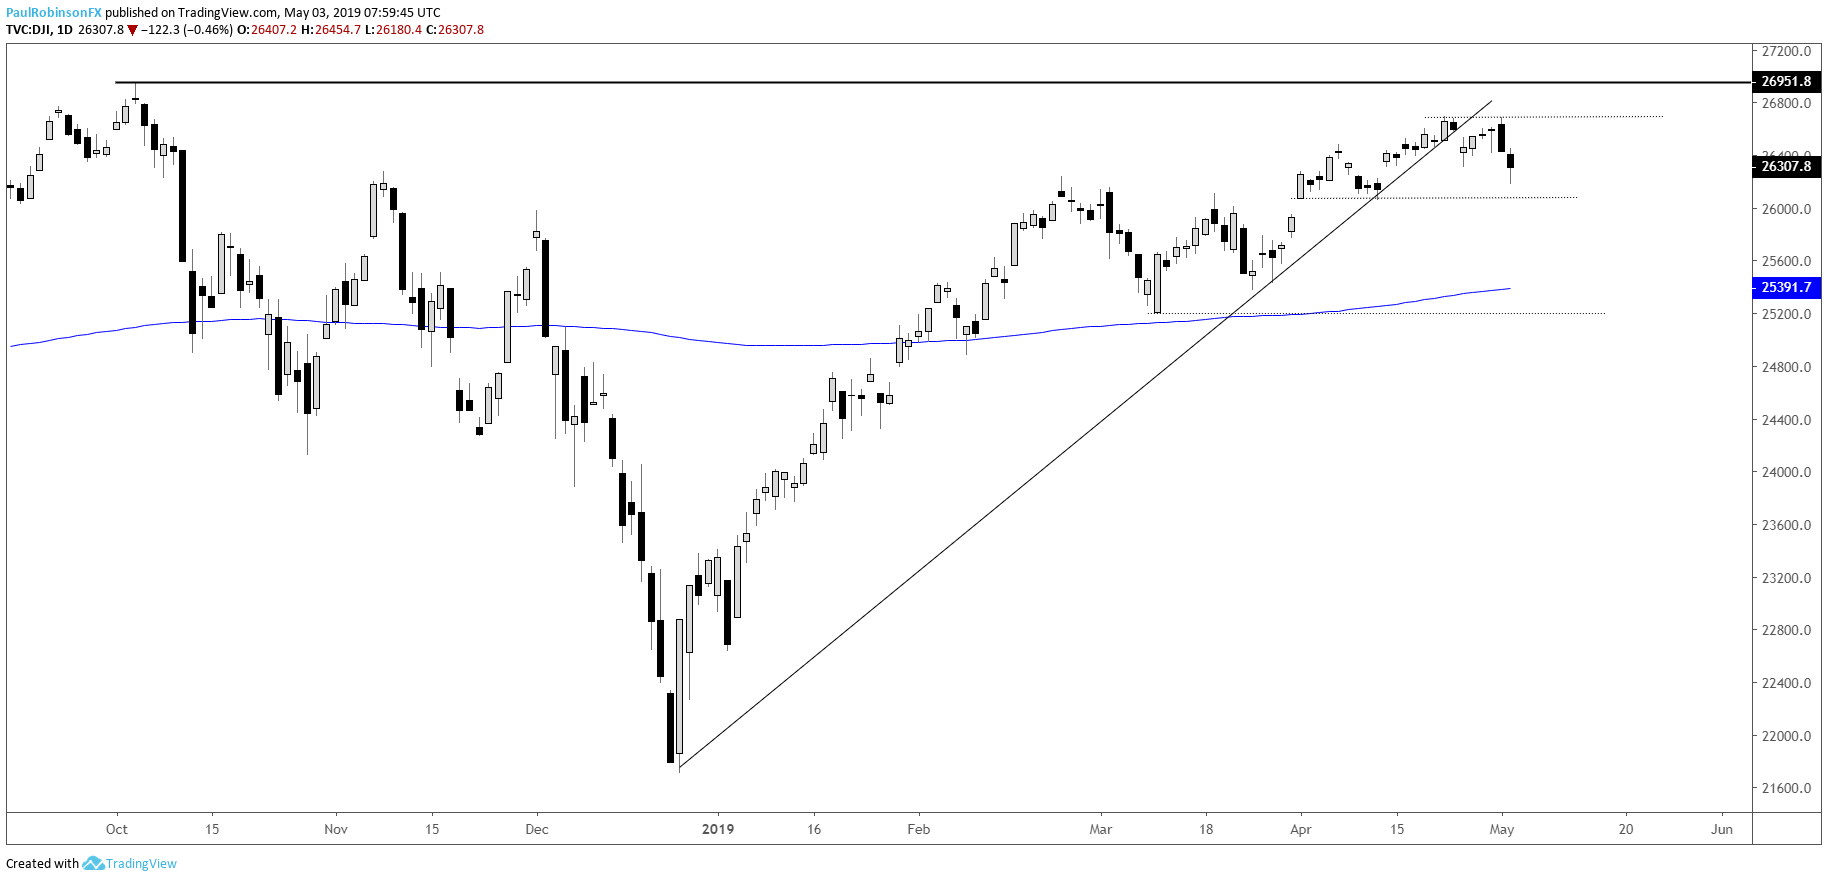
Dow Jones downside leader at the moment
The Dow Jones has been the laggard lately, with it still having yet followed the S&P 500 and Nasdaq 100 to new record highs. Yesterday, the Dow nearly filled the April 12 gap. If the S&P breaks the above noted support then look for the Dow to continue acting as a downside leader with the 200-day MA at 25391 first targeted, followed by 25208. A breakout above 26696 will quickly bring into play the record intra-day high at 26951 and better.
Dow Jones Daily Chart (broken trend-line, wedge)
Nasdaq 100 at record high but extended
The Nasdaq 100 is sitting at a crossroad of support, with the old record highs and trend-line from December crossing each other’s paths. This confluent support comes just as the S&P is teetering out of the rising wedge. A breakdown below support along with the S&P breaking 2892 should have the index reeling. The 7505, 7252, and 7145 levels will be watched on weakness. Should support hold and a breakout above 7852 ensue, then the run higher continues…
Nasdaq 100 Daily Chart (at crossroad of support)

To learn more about U.S. indices, check out “The Difference between Dow, Nasdaq, and S&P 500: Major Facts & Opportunities.” You can join me every Wednesday at 10 GMT for live analysis on equity indices and commodities, and for the remaining roster of live events, check out the webinar calendar.
Tools for Forex & CFD Traders
Whether you are a beginning or experienced trader, DailyFX has several resources available to help you; indicator for tracking trader sentiment, quarterly trading forecasts, analytical and educational webinars held daily, trading guides to help you improve trading performance, and one specifically for those who are new to forex.
---Written by Paul Robinson, Market Analyst
You can follow Paul on Twitter at @PaulRobinsonFX


