


S&P 500/Nasdaq 100/Dow Technical Highlights:
- S&P 500 rising wedge still developing
- Nasdaq 100 has record highs just ahead
- Dow Jones backing down into support
Check out the fundamental and technical forecast for stocks as they rise towards record highs in the Q2 Equity Markets Forecast.
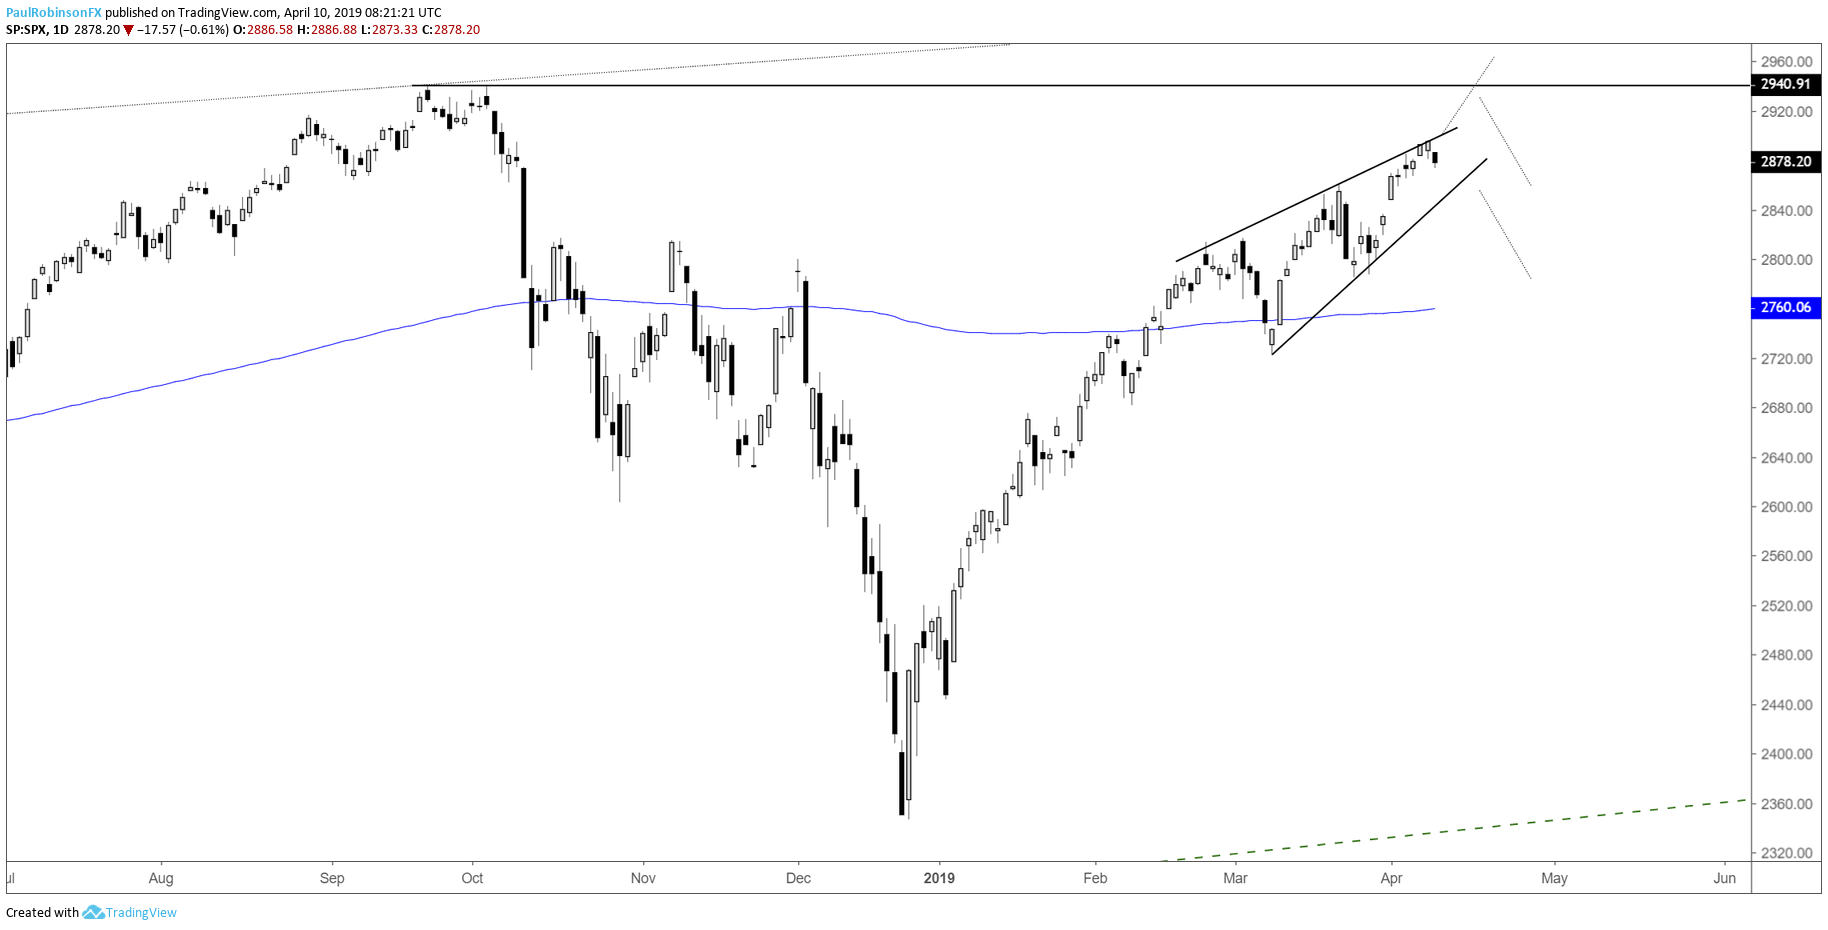
S&P 500 rising wedge still developing
A week ago, I looked at the rising wedge formation developing in the S&P 500 and the potential scenarios that could result from a fully formed pattern. To recap: Break to the top-side and challenge record highs, break to the top-side in head-fake fashion before diving lower, break the underside of the pattern and sell off. One bullish, two bearish potential outcomes.
So far of course we have seen none of the above, but we are nearing the moment of truth for the pattern. These patterns are often bearish after strong rises, but until price action confirms one scenario or another we’ll need to remain patient. For the sake of rising volatility (generally a trader’s friend) one of the two bearish outcomes is most ideal.
Traders are generally short the S&P 500, find out on the IG Client Sentiment page what this could be for prices moving forward.
S&P 500 Daily Chart (Rising wedge…)
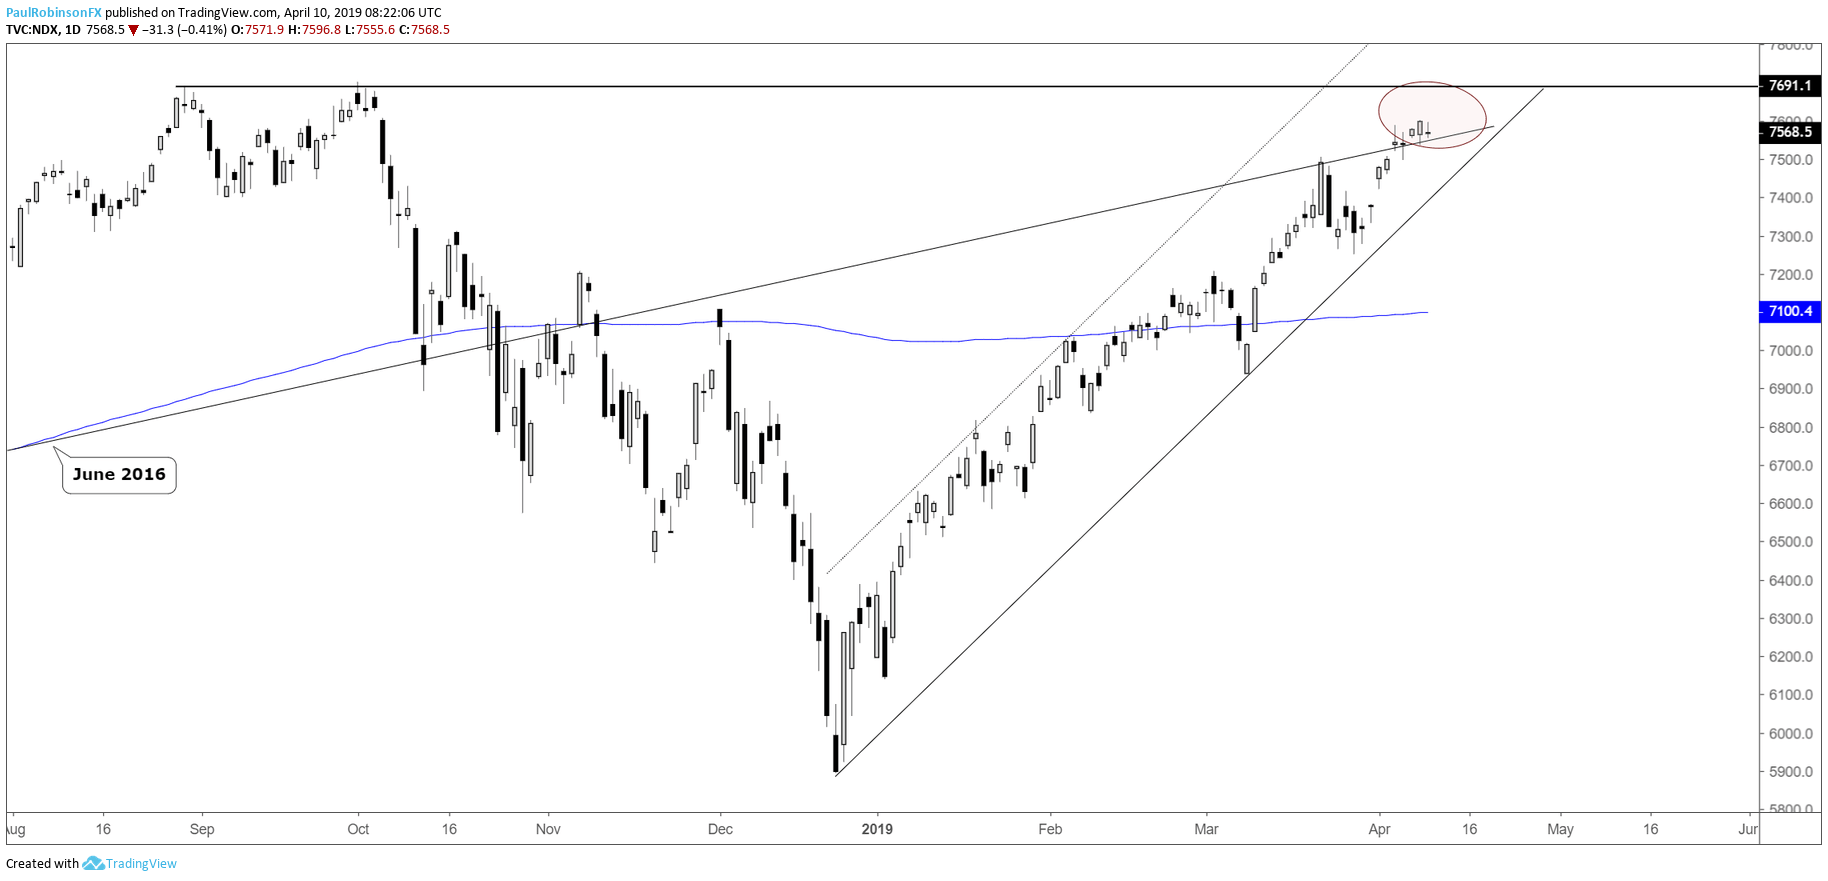
Nasdaq 100 has record highs just ahead
The Nasdaq 100 has been a monster, which is a good thing for the broader market considering it is home to perhaps the most important sector in the market, FAANG. The NDX is currently hanging out around the June 2016 slope, but even more important is the fact that just ahead lies the double-top record high from late last year. Watch for a pick-up in volatility around 7700 should it soon be challenged; might at the least get a pullback even if the market is to blast on through to new record highs. Don’t forget about the rising wedge in the S&P 500…
Nasdaq 100 Daily Chart (June ’16 slope, record highs)
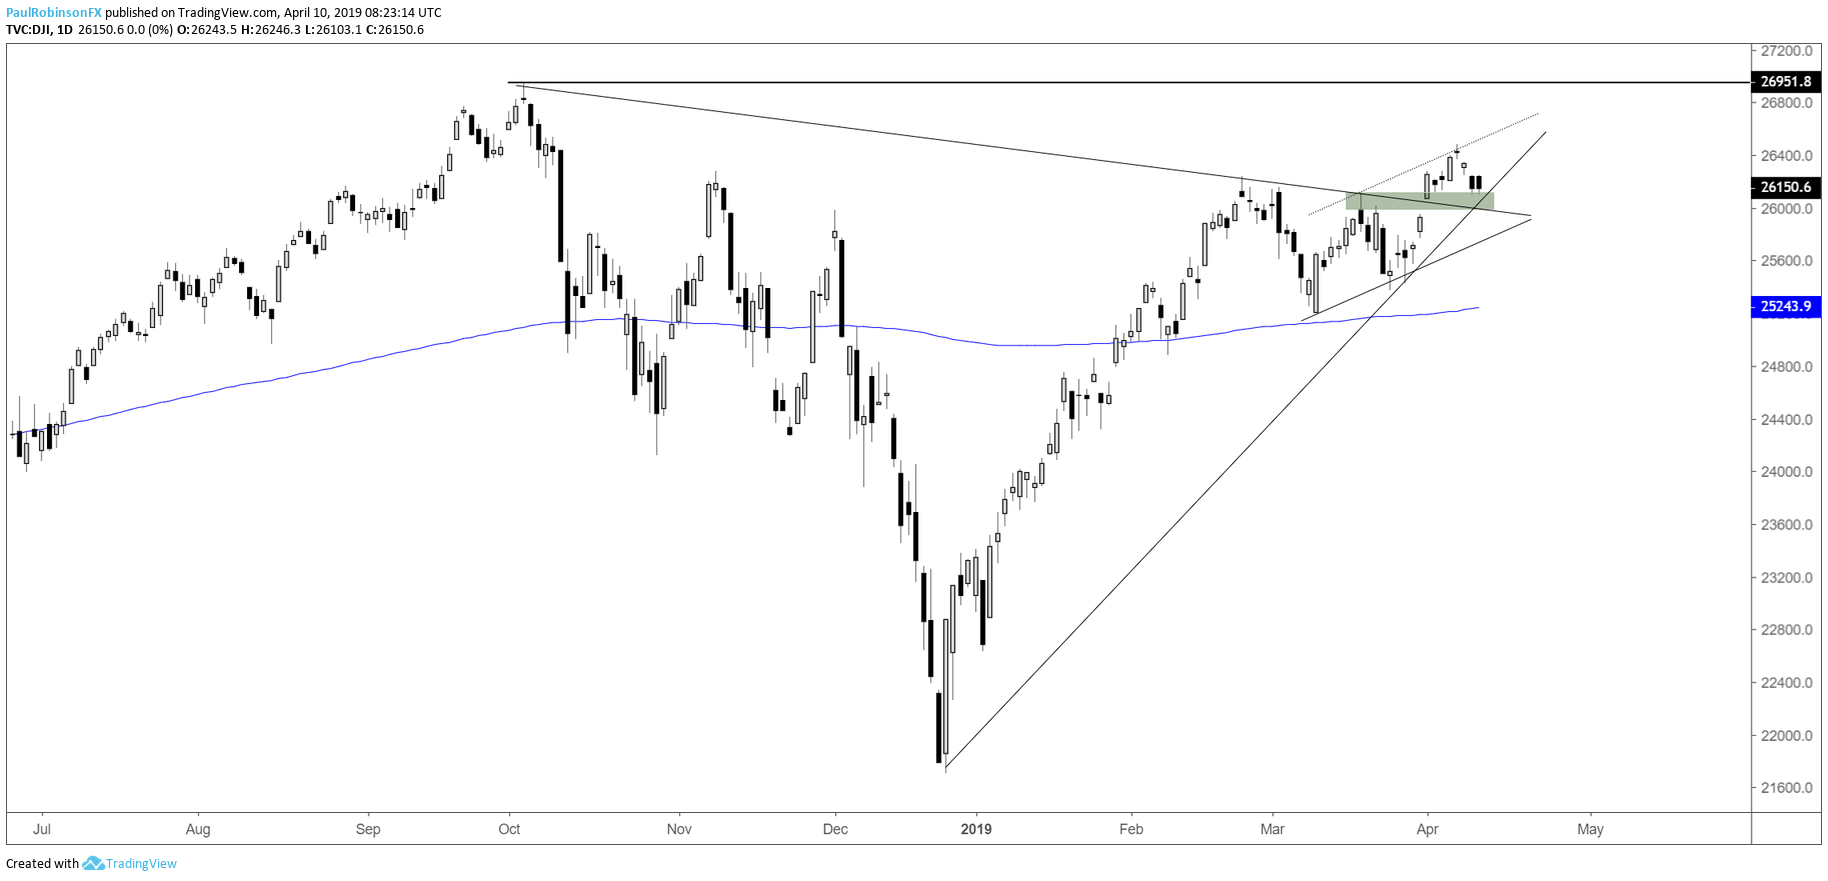
Dow Jones backing down into support
The Dow is backing down into support via both price and a sharp trend-line off the December low. Nothing pervasive about the way it has weakened the past couple of sessions, which suggests the decline is only corrective and not the beginning of a larger sell-off. A decline below 25800 may be cause for a switch in this bias.
Dow Daily Chart (trading into support)
To learn more about U.S. indices, check out “The Difference between Dow, Nasdaq, and S&P 500: Major Facts & Opportunities.” You can join me every Wednesday at 10 GMT for live analysis on equity indices and commodities, and for the remaining roster of live events, check out the webinar calendar.
Tools for Forex & CFD Traders
Whether you are a beginning or experienced trader, DailyFX has several resources available to help you; indicator for tracking trader sentiment, quarterly trading forecasts, analytical and educational webinars held daily, trading guides to help you improve trading performance, and one specifically for those who are new to forex.
---Written by Paul Robinson, Market Analyst
You can follow Paul on Twitter at @PaulRobinsonFX


