


S&P 500/Dow Jones Technical Highlights:
Fresh quarterly forecasts are out! Check out the Trading Guides page for these and other guides to help you get off to a good start to 2019.
S&P 500 has room to trade higher
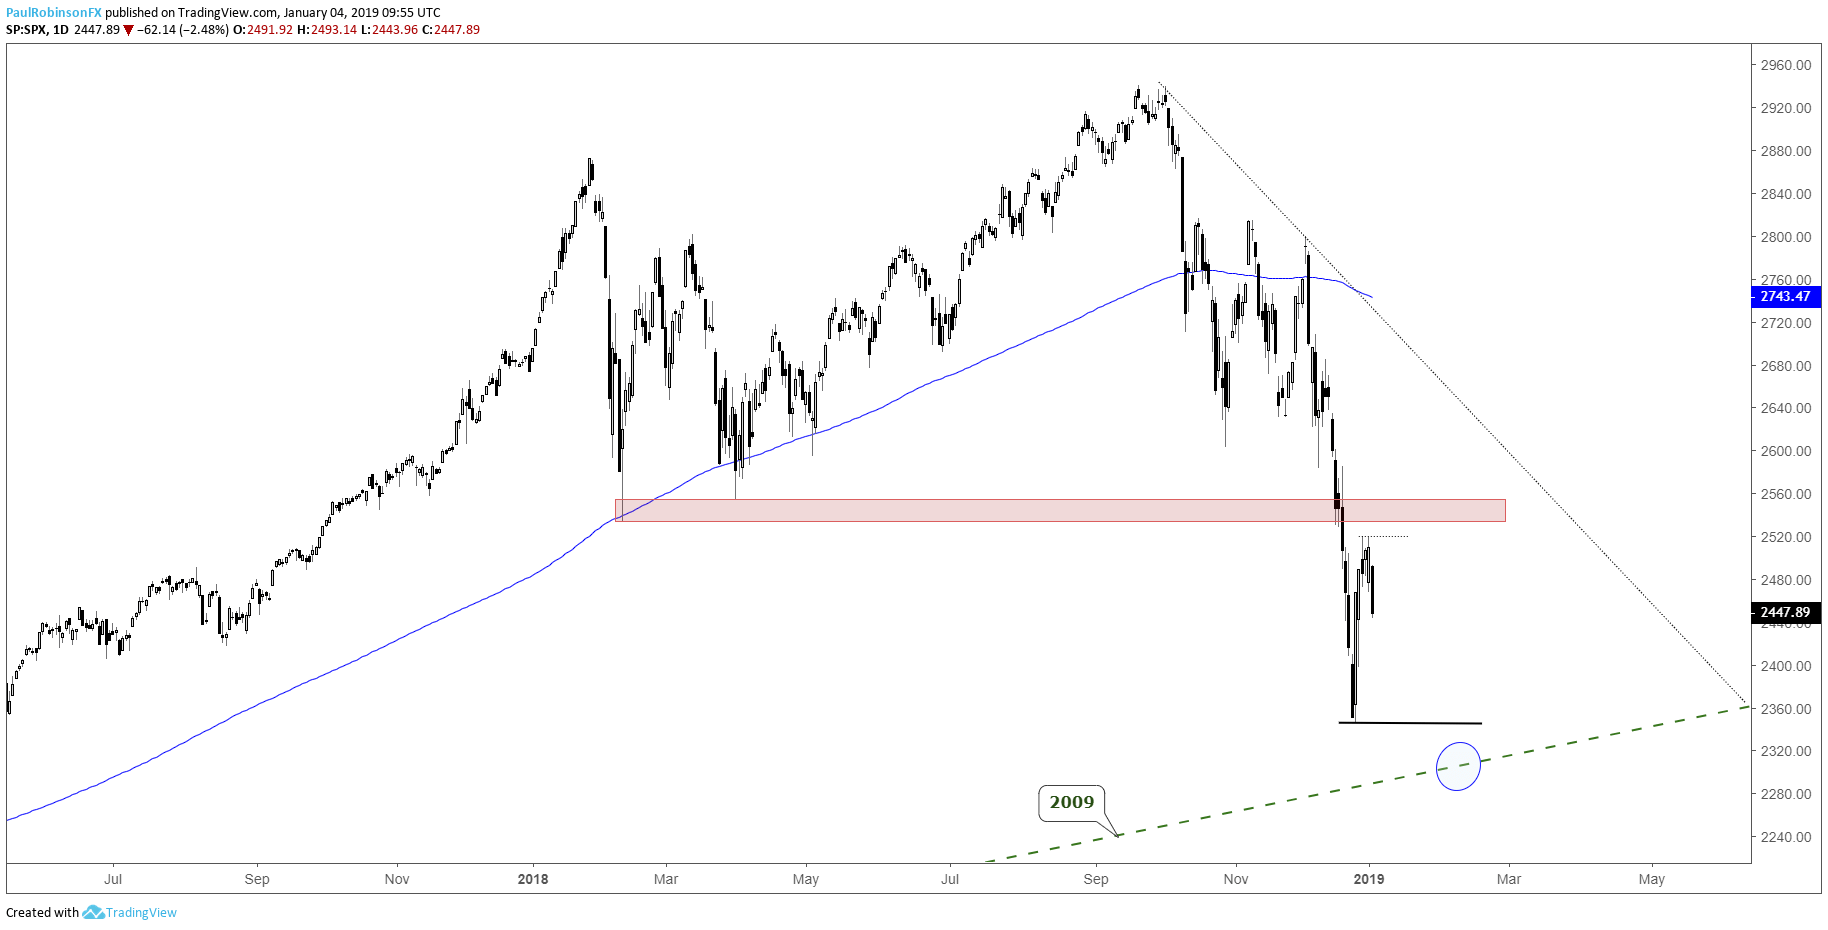
The swoon and sudden reversal to end the year looks to have put a floor in the market for now, giving the S&P 500 a chance to make good on another push higher in the near-term. A higher low, whether it began yesterday or soon from lower prices, looks to be a likely scenario as the market gains further footing.
A rally, though, will come under fire quickly as the low from early 2018 comes into view not far beyond the swing-high set on December 28. Resistance runs from around 2530 up to 2555. If the market were to fail to trade higher in the near-term and selling begins to accelerate again, look for the 2346 low to hold and if not at worst a move to the bull market trend-line from 2009 before seeing bids come in again.
While much lower prices are expected this year, a bounce or stabilization at the least, look to be in store this quarter. There will be some good two-way trade during this period, the key will be flexibility and not getting caught trying to chase momentum.
With global markets having fallen sharply, see where our analysts see stocks headed in the Q1 Global Equities Forecast.
S&P 500 Daily Chart (Looking for early 2018 lows)
Dow has resistance to overcome in near-term
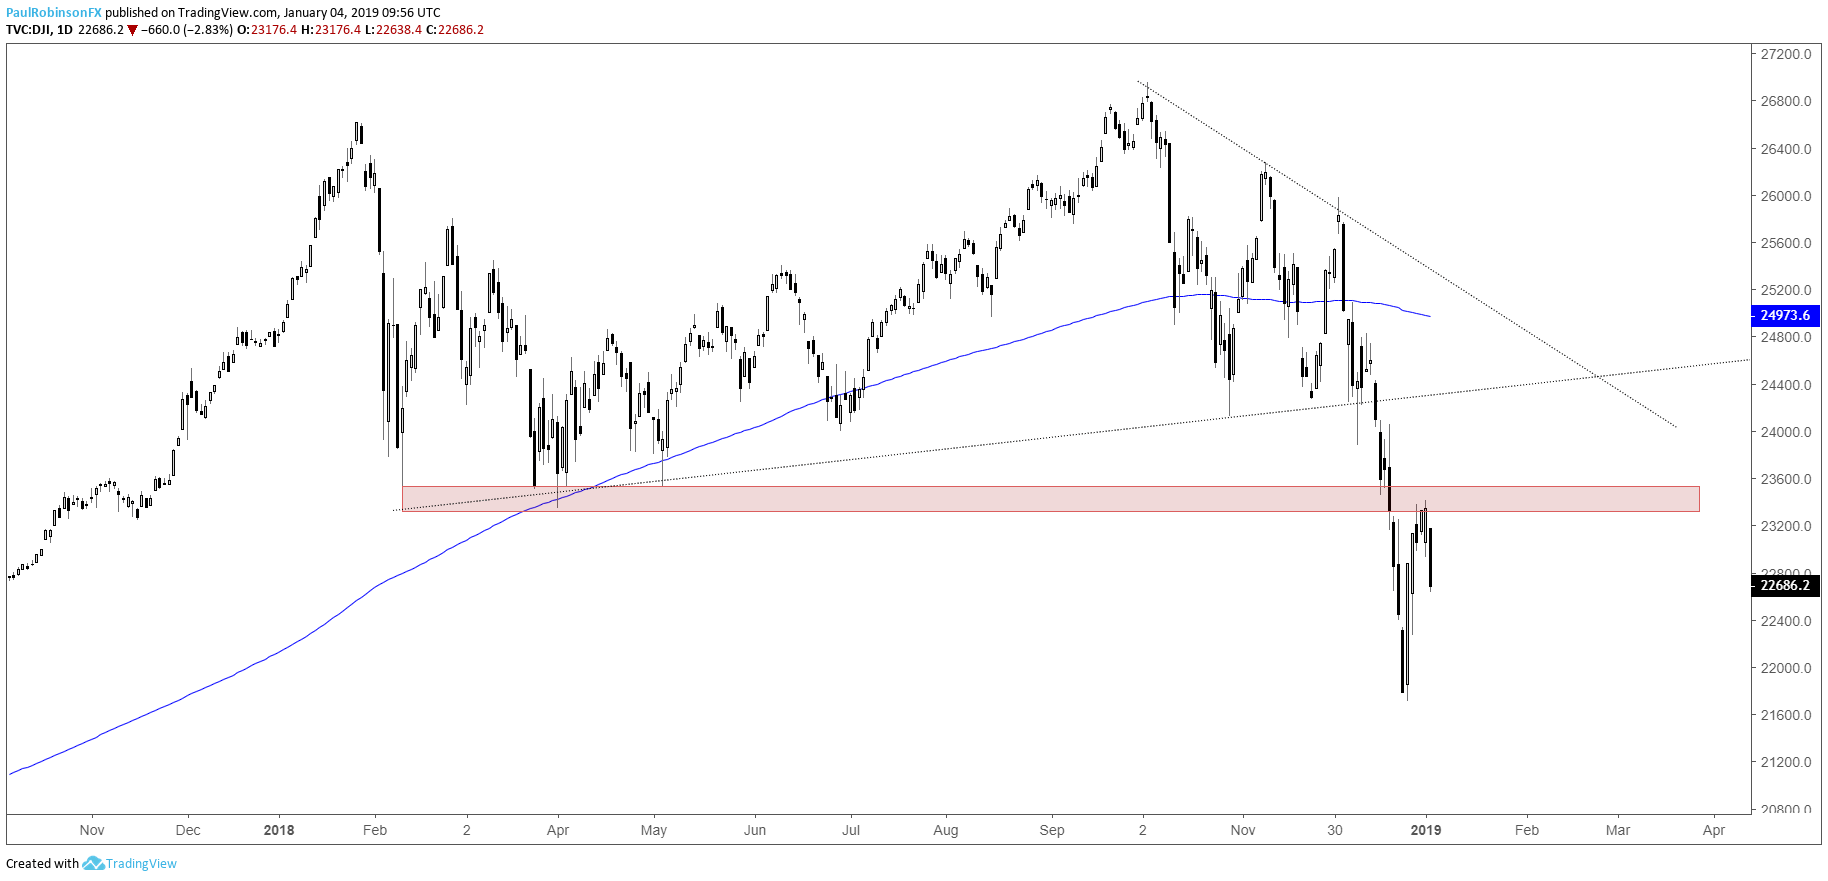
The Dow already ran aground into the early 2018 lows, a spot from which yesterday’s sell-off began from. If the S&P is to carry higher into its own levels from last year, then either the Dow will lag and stay capped or find its way through those lows.
The separation to resistance in the S&P makes it a more attractive long candidate, while the Dow if it can’t get through resistance may offer short-term ‘would-be’ shorts a solid backstop from which to set stops for another dive lower. But, as already stated with the S&P, I’m not looking for weakness to be sustainable, making short trades quick hitters that are at risk of quickly reversing.
Dow Jones Daily Chart (Early 2018 lows present a hurdle)
To learn more about U.S. indices, check out “The Difference between Dow, Nasdaq, and S&P 500: Major Facts & Opportunities.” You can join me every Wednesday at 10 GMT for live analysis on equity indices and commodities, and for the remaining roster of live events, check out the webinar calendar.
Tools for Forex & CFD Traders
Whether you are a beginning or experienced trader, DailyFX has several resources available to help you; indicator for tracking trader sentiment, quarterly trading forecasts, analytical and educational webinars held daily, trading guides to help you improve trading performance, and one specifically for those who are new to forex.
---Written by Paul Robinson, Market Analyst
You can follow Paul on Twitter at @PaulRobinsonFX


