


S&P 500/Nasdaq 100/Dow Jones Technical Highlights:
- S&P 500 rallied to trend-line, just shy of 200-day
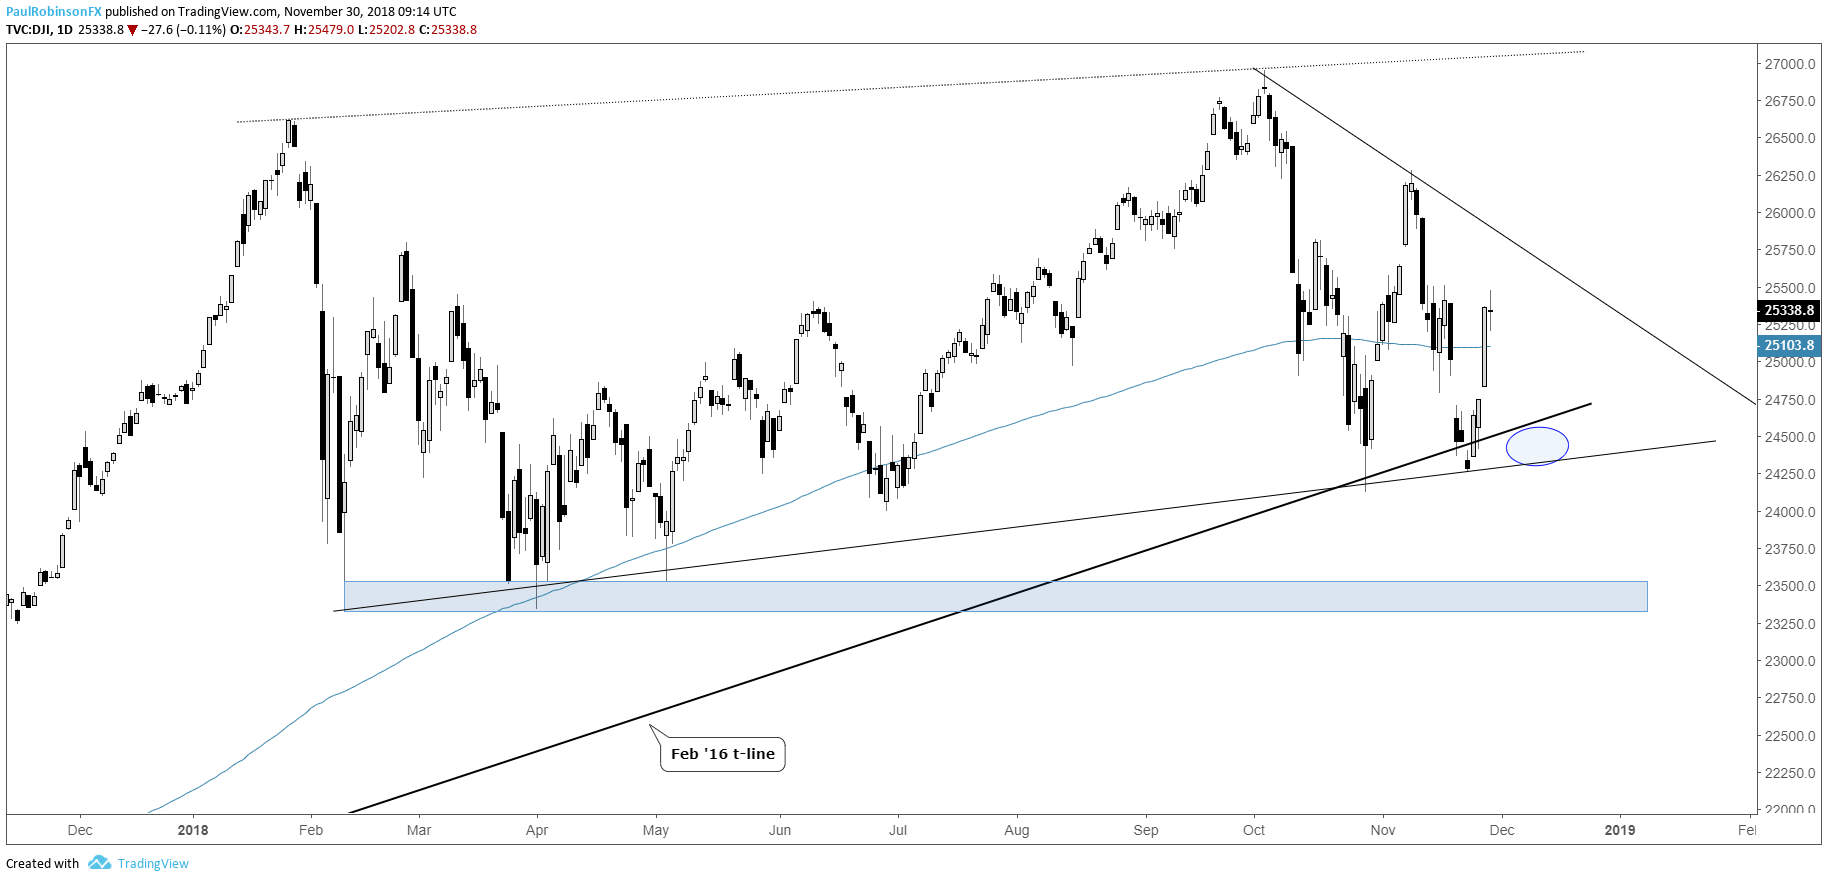
- Dow Jones bounced from support, another test could come soon
- Nasdaq 100 also rallied to trend-line resistance
With global stocks falling sharply, see how this fits into our outlook for the remainder of the year in the Q4 Global Equities Forecast.
U.S. stock rally looks like another corrective bounce
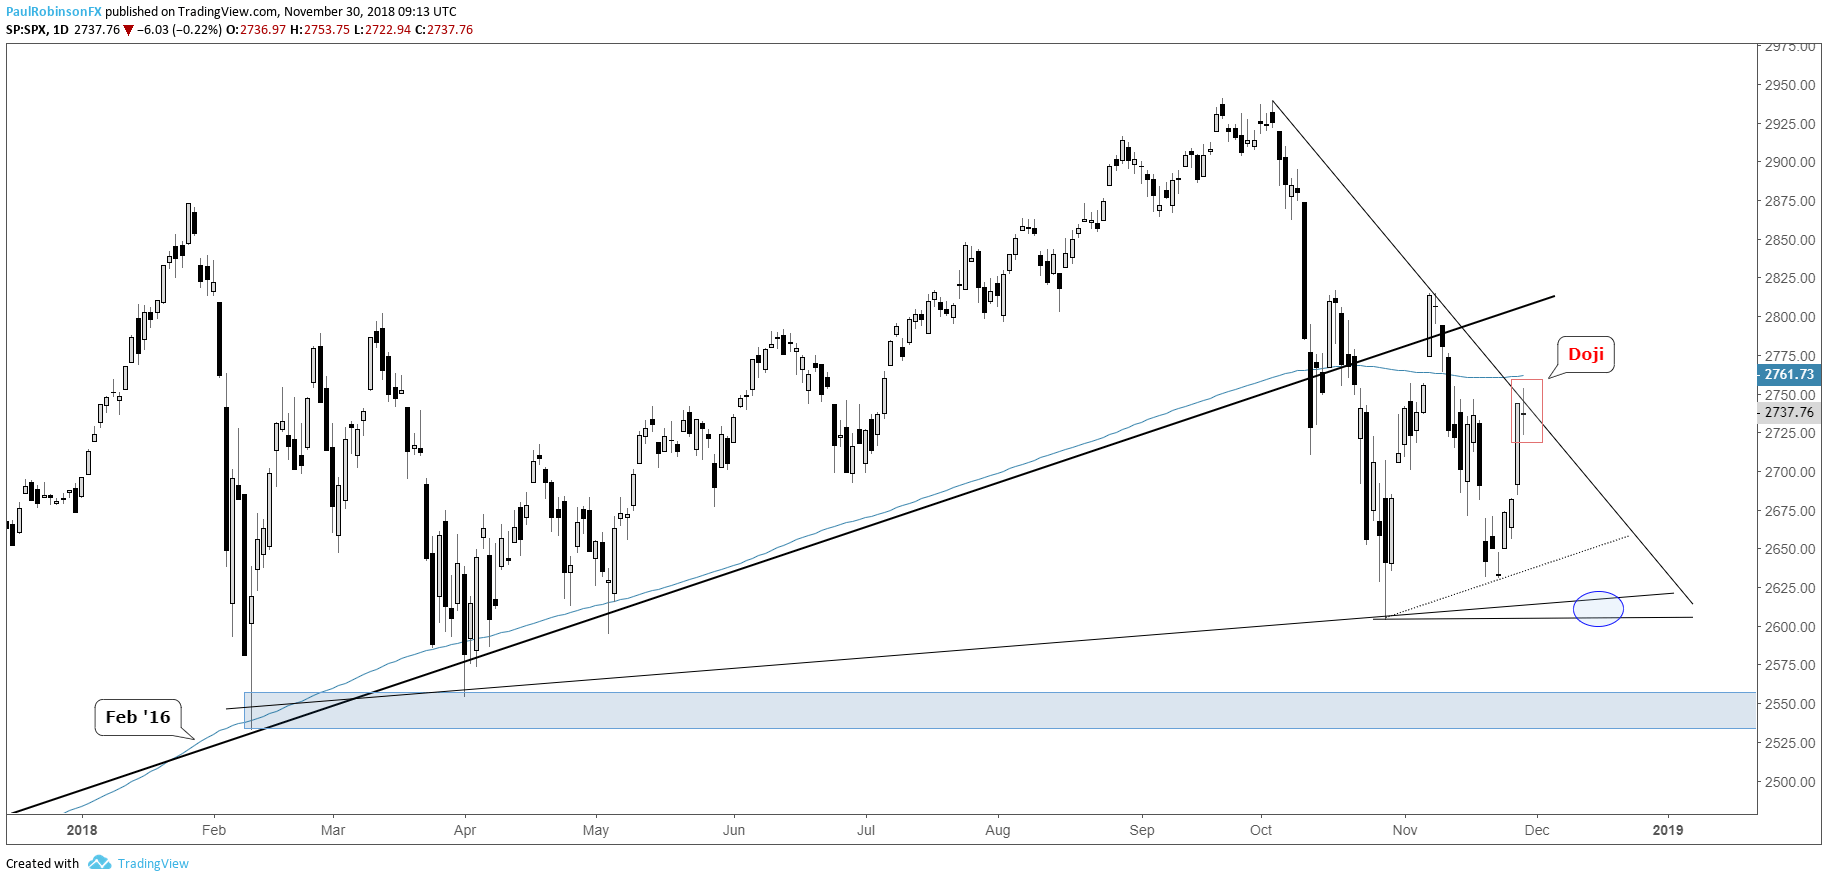
The sharp rally in stocks this week doesn’t look likely to last, and in fact yesterday may have been the end of the bounce. The S&P 500 finished off yesterday with a Doji candlestick at the trend-line running down off the record high.
The candle at resistance suggests upward momentum may have met its match in selling. Even if the market were to resolve a bit higher first, the 200-day is just a short ways higher and should prove challenging to maintain above. As long as price stays below the last bounce high of 2815 the market remains tilted lower.
But if the market is to make good on the Doji at resistance then we should see the market start to turn down today. On a push lower the S&P will run into good support from around 2635 to 2603, but the early-year lows from Feb and April remain the target for now.
Traders are reacting to the uptick to volatility, to see how check out the IG Client Sentiment page.
S&P 500 Daily Chart (Doji at trend-line)
Dow Jones bounced from support, another test could come soon
The Dow lifted from an area of confluence between the February 2016 trend-line and the one crossing over from February of this year. While the Dow doesn’t have the same trend resistance close at hand as does the S&P 500 and Nasdaq 100, it will of course turn down nevertheless if the others do too. A breakdown will again have the area from around 24475 to 24120 in focus again. A below there would quickly bring into play the early-year lows around 23300.
Dow Daily Chart (Rollover will have confluent support back in focus)
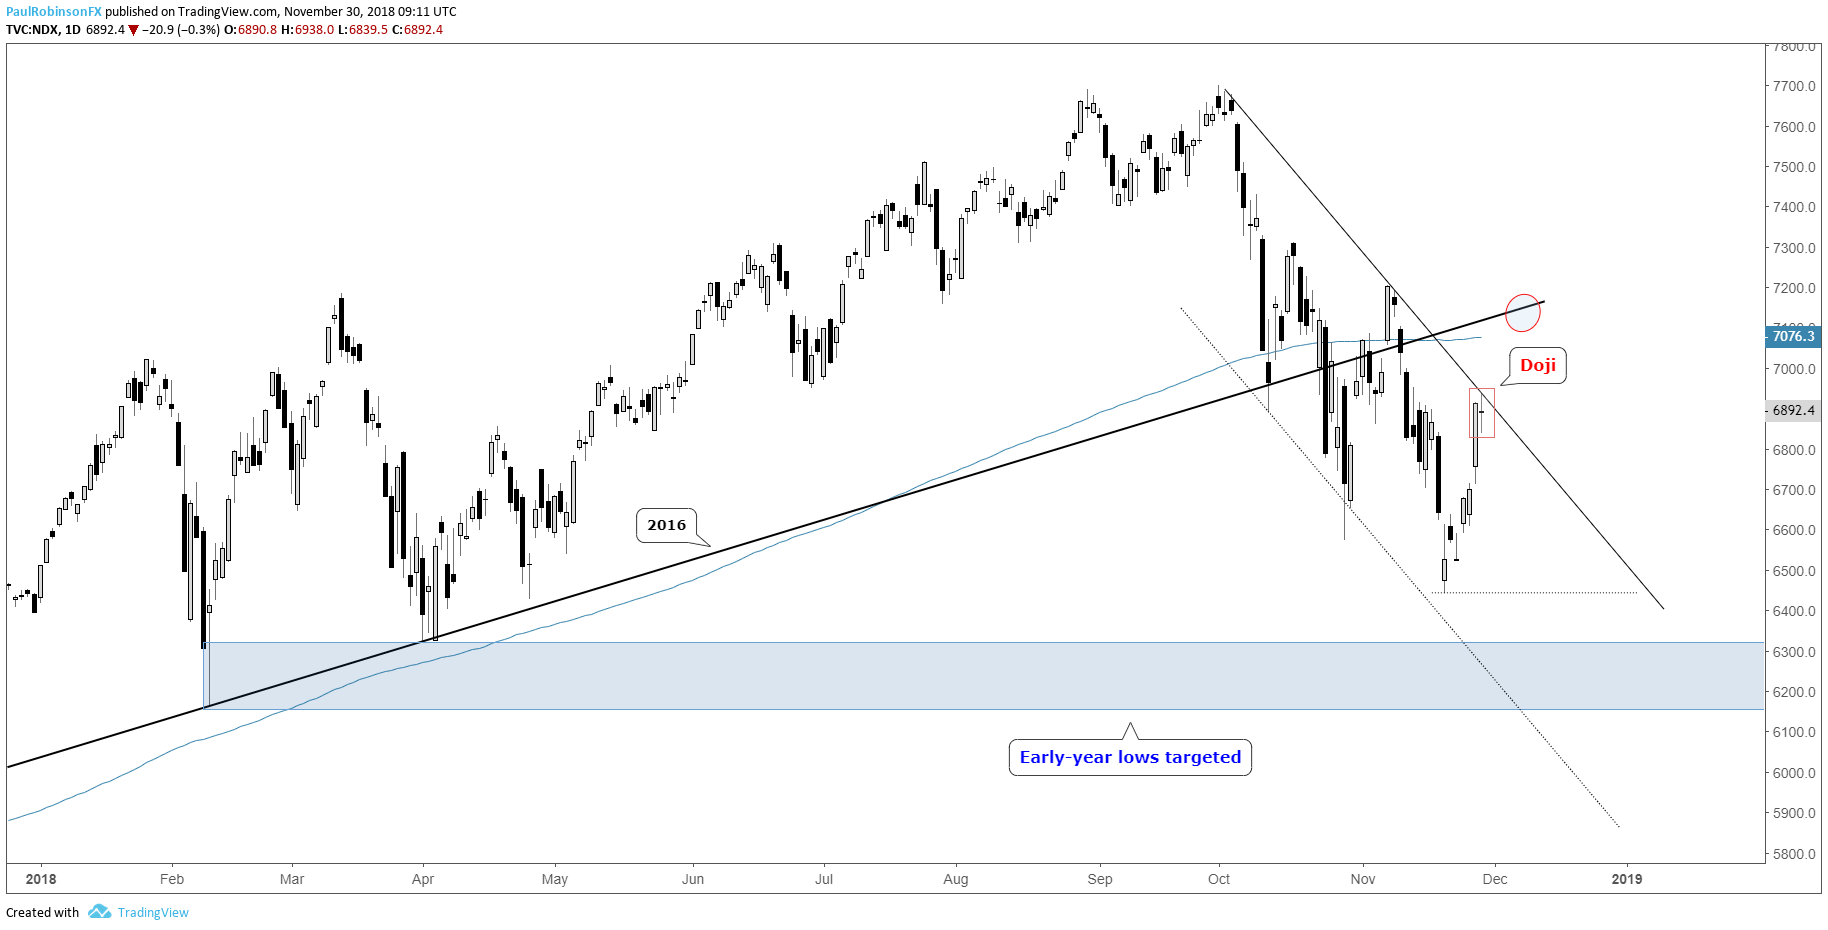
Nasdaq 100 also rallied to trend-line resistance
The leading Nasdaq 100, like the S&P, posted a Doji candle yesterday and on that if it is to make good on it will need to turn down now. The path towards the year lows is a bit cleaner, and with one more shove in the broader market it should have those tested, if not worse. As break higher above the trend-line doesn’t give the market much more to cheer about as the 200-day lies ahead, and just as is the case with the S&P, as long as the 11/7 high isn’t breached the market remains leaning lower.
Nasdaq 100 Daily Chart (Doji at trend-line)
To learn more about U.S. indices, check out “The Difference between Dow, Nasdaq, and S&P 500: Major Facts & Opportunities.” You can join me every Wednesday at 10 GMT for live analysis on equity indices and commodities, and for the remaining roster of live events, check out the webinar calendar.
Tools for Forex & CFD Traders
Whether you are a beginning or experienced trader, DailyFX has several resources available to help you; indicator for tracking trader sentiment, quarterly trading forecasts, analytical and educational webinars held daily, trading guides to help you improve trading performance, and one specifically for those who are new to forex.
---Written by Paul Robinson, Market Analyst
You can follow Paul on Twitter at @PaulRobinsonFX


