


S&P 500/Dow Highlights:
- S&P 500 reversed from record territory
- At risk of a near-term pullback
- Watching Dow chart pattern for further cues
For longer-term trading ideas, Q3 forecasts, and a library of educational content, check out the DailyFX Trading Guides
S&P 500 reversed from record territory
On an intra-day basis yesterday, the S&P 500 poked its head above the prior record high set back in January before slipping back lower and forming a smallish reversal bar. The reversal warns of caution in the near-term.
How much of course we will have to see yet, it will depend on how it unfolds: whether it’s with or without momentum. Trend-line support from June could come into play if the pullback plays out as it has the past couple of times in recent weeks.
Traders remain largely short the S&P 500, check out the IG Client Sentiment page to see how this acts as a contrarian indicator.
S&P 500 Daily Chart (Reverses from record territory)

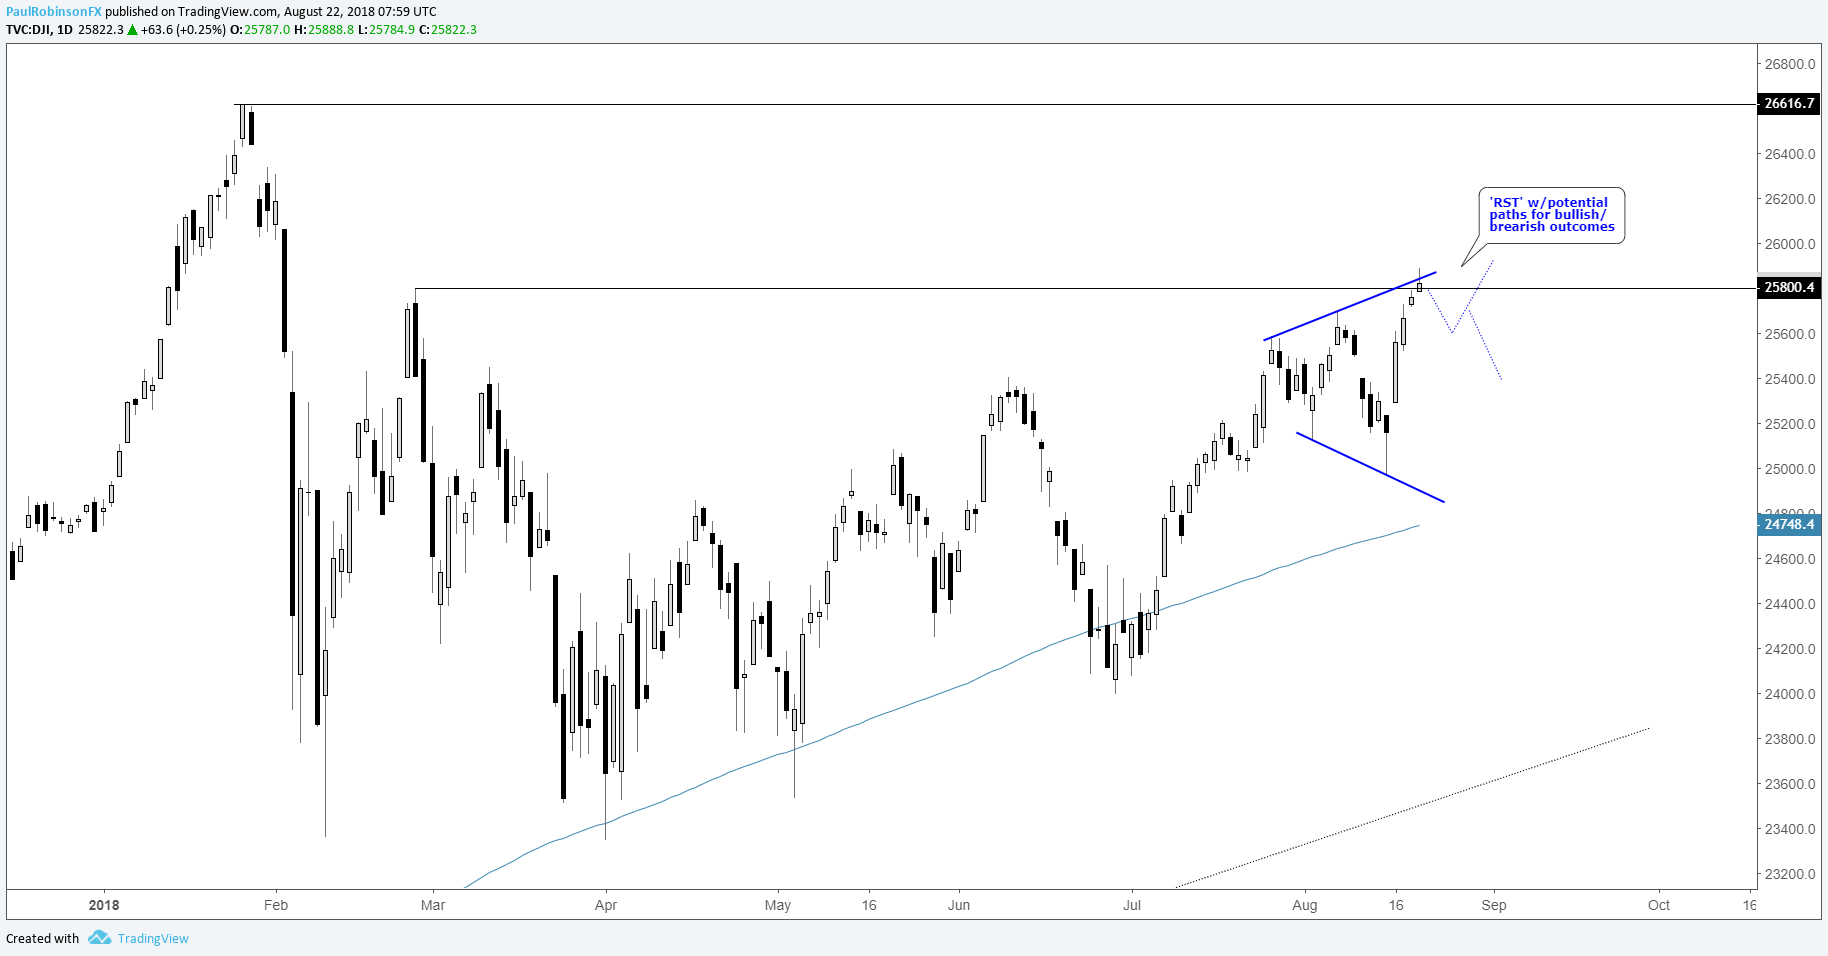
Watching Dow chart pattern for further cues
The Dow has our attention due to the chart pattern it has been forming for nearly a month. The Reverse Symmetrical Triangle, or ‘RST’ for short, isn’t the most common pattern, but can be a powerful one. It’s also known to some as a ‘Megaphone’ due to its shape. These can be reversal or continuation patterns.
Here is the premise behind these formations: Expanding price swings indicates growing indecision, or instability, and with that will eventually come a resolution as one side of the market wins out. Here is what to look for in determining whether it will resolve bullishly or bearishly.
The next move couple of moves holds the key. Whether from yesterday’s high or just a bit higher, the market is likely to undergo a pullback. If the market can put in a modest pullback and trade back through the high of the formation, then look for the Dow to propel higher.
However, if the market pulls back and either a.) the Dow tries to rally but fails, forming a small lower high, then once the low of the pullback is undercut look for price to pick up downside momentum, or b.) if the market reverses swiftly lower look for the low-end of the pattern and worse to play out. Scenario ‘a’ is the easier of the two to execute shorts given it has the pullback low to use as a spot to short if broken.
In any event, the pattern arrives at an interesting spot given the Dow is trading around the swing-high from February. The only fly-in-the-ointment could be the fact that it is getting towards the end of August and the summer doldrums could undermine the quality of trade. As we’ve been saying, if it’s there it’s there, but if it’s not, don’t force the issue – market participation will pick up again in the weeks ahead and with it a better trading environment.
Dow Daily Chart (‘RST’ pattern)
We just put together a piece recently highlighting the differences between the three major U.S. indices – ‘Difference Between Dow, Nasdaq, and S&P 500: Major Facts & Opportunities.’. Check it out to learn the varying characteristics one should know if you are going to trade them.
Resources for Forex & CFD Traders
Whether you are a new or experienced trader, we have several resources available to help you; indicator for tracking trader sentiment, quarterly trading forecasts, analytical and educational webinars held daily, trading guides to help you improve trading performance, and one specifically for those who are new to forex.
---Written by Paul Robinson, Market Analyst
You can follow Paul on Twitter at @PaulRobinsonFX


