S&P 500 Highlights:
- S&P 500 trying to carve out higher high, higher low sequence
- Climb through 2742 will have 2800+ in focus
- Weekly low likely needs to hold to keep tone positive
See what factors have been driving the S&P 500 and find out how our Top Trading Opportunities for 2018 are doing YTD – DailyFX Trading Guides
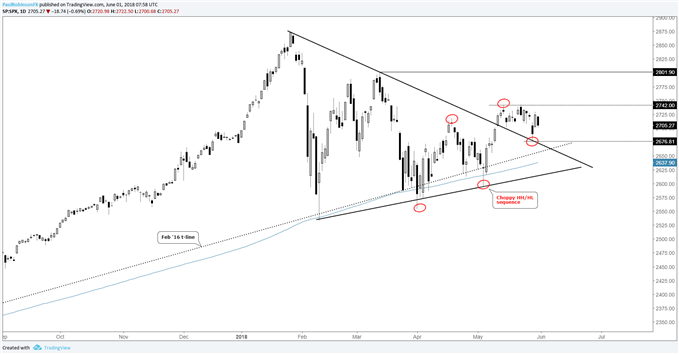
Since bottoming at the beginning of April the S&P 500 has been in the process of slowly (and sloppily) putting together a string of higher-highs and higher-lows, with the second higher-low coming at the all-important confluence between the 200-day and Feb 2016 trend-line.
Overall, the market has a semi-positive feel to it at the moment with a couple of recent gap-downs not leading to follow-through selling, as buyers are showing a willingness to step in on weakness. The drop on Tuesday saw a successful retest of the trend-line running off the record high before Wednesday's surge.
A breakout above 2742 will clear way for a potential move to the March high just over 2800, and yet another higher-high since early April. On the flip-side, to keep the tone positive, the weekly low at 2676 and trend-line off the highs need to hold.
If the lower levels don’t hold, then yet another test of the bull-market line-in-the-sand will be in store – the 200-day/Feb 2016 trend-line combination. A 4th test since February might prove to be a fatal one. While we are carving out a bullish sequence in the shorter-term, since January the recent high could be another lower-high, when pulling back to a more intermediate-term view.
A decline below the aforementioned line-in-the-sand would imply a significant topping sequence has been cemented. Right now, it’s a battle between a semi-positive structure since April and a possibly much more bearish one since January. Indeed, the market at this juncture is in limbo.
Confidence is key, check out this guide for 4 ideas on Building Confidence in Trading
S&P 500 Daily Chart

If you’d like to listen in on live technical analysis on global equity indices (and commodities), join me every Tuesday at 9 GMT time.
Resources for Forex & CFD Traders
Whether you are a new or experienced trader, we have several resources available to help you; indicator for tracking trader sentiment, quarterly trading forecasts, analytical and educational webinars held daily, trading guides to help you improve trading performance, and one specifically for those who are new to forex.
---Written by Paul Robinson, Market Analyst
You can follow Paul on Twitter at @PaulRobinsonFX


