


S&P 500 Highlights:
- S&P 500 testing top-side trend-line of wedge
- Top and drop, or consolidation pattern?
See what factors are driving the S&P 500 this quarter and find out how our Top Trading Opportunities for 2018 are doing on the Trading Guides page.
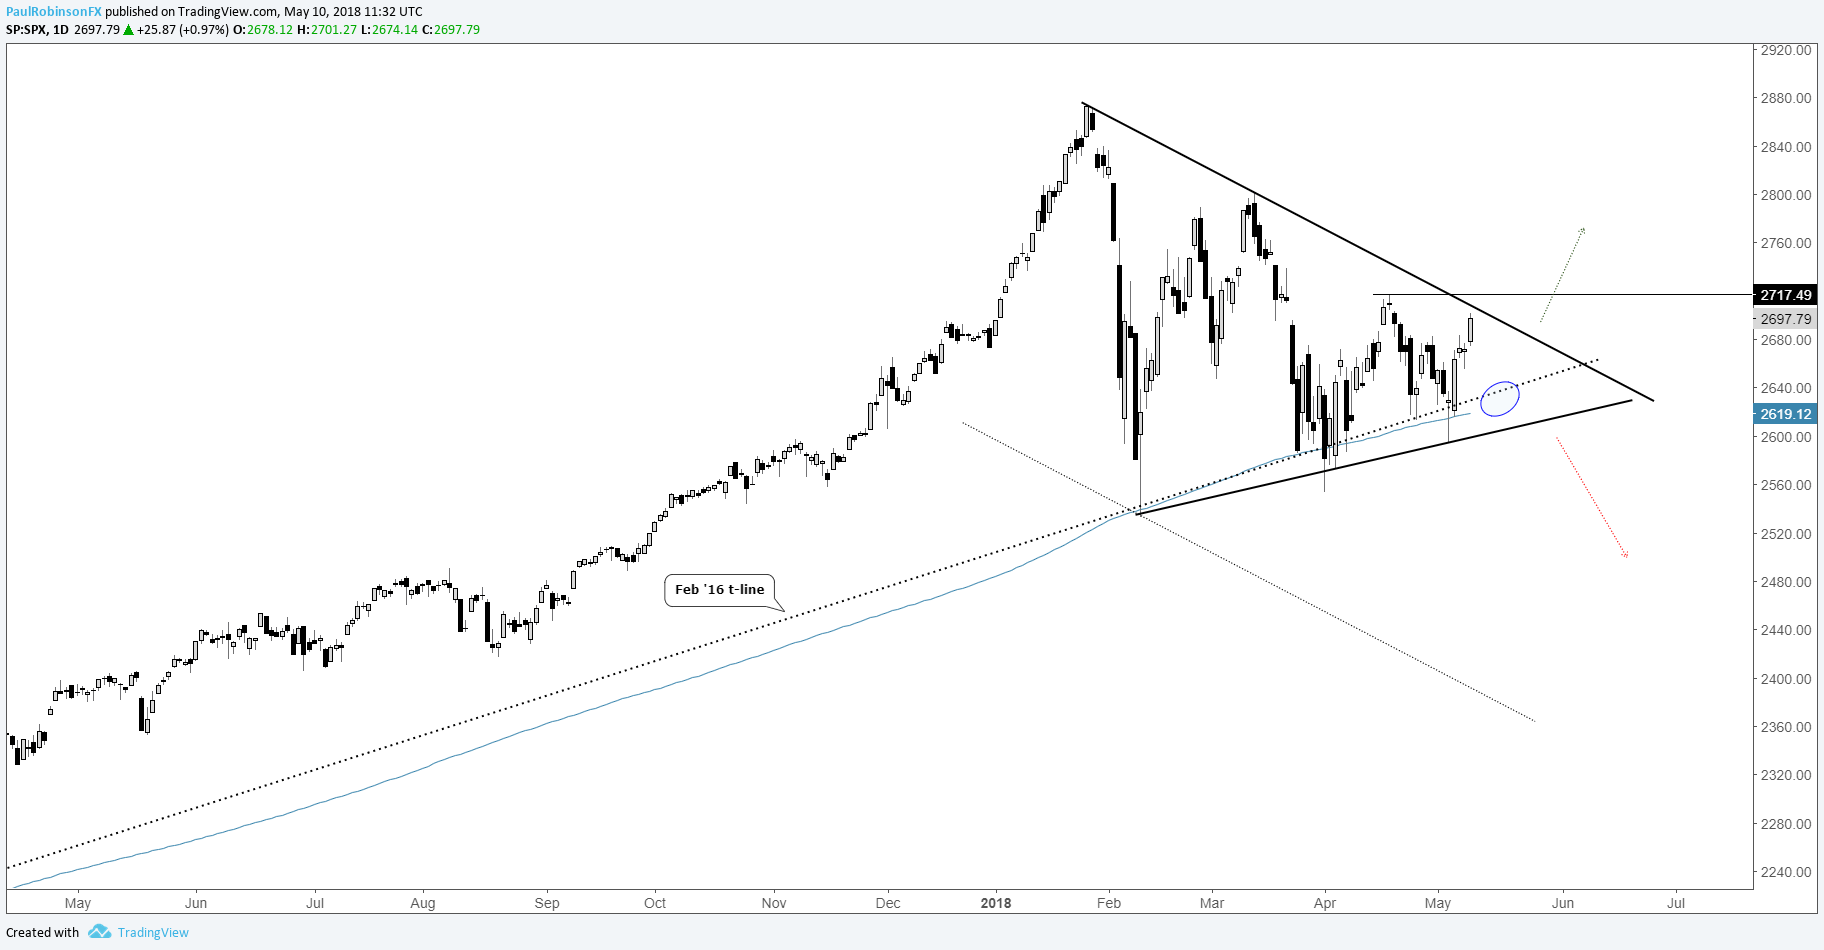
The debate continues – is the market topping or consolidating? It could be either, but the broad wedge formation under development could soon give us a definitive answer. The most recent drive off the February 2016 trend-line and 200-day MA has the top-side trend-line of the triangle in play.
We’re at a fairly important juncture here in the short-term and possibly big-picture, too. In the short-run, the market runs the risk of another turn lower, but a downturn might not last long as the 2016 trend-line/200-day MA (in confluence) are rising levels of support. The bottom of the triangle lies just below this confluence of support, so even on a slight breakdown there is another line which could keep the market held up.
In either event – whether we see a breakdown confirming a top, or a consolidation pattern leading to higher prices – a little more time for the pattern to tighten up the pattern is ideal. The size of the pattern points to a sizable move of over 300 points from the point of a breakout. A downside break will hold the most violent move.
Struggling right now? (Happens to the best) We’ve got a guide designed to help you – Building Confidence in Trading
S&P 500 Daily Chart (Triangle forming)
If you’d like to listen in on live analysis pertaining to global equity indices (and commodities), join me every Tuesday at 10 GMT time for technical insights.
Resources for Forex & CFD Traders
Whether you are a new or experienced trader, we have several resources available to help you; indicator for tracking trader sentiment, quarterly trading forecasts, analytical and educational webinars held daily, trading guides to help you improve trading performance, and one specifically for those who are new to forex.
---Written by Paul Robinson, Market Analyst
To receive Paul’s analysis directly via email, please SIGN UP HERE
You can follow Paul on Twitter at @PaulRobinsonFX


