


What’s inside:
- Bull market long in the tooth
- Price sequence suggests the end is near, relatively speaking
- Valuations are rich, very rich
- Eventual decline could easily exceed 30%, the 'R' word, Fed turns rate hikes into rate cuts
See the Webinar Calendar for a schedule of upcoming live events with DailyFX analysts.
Bull market long in the tooth
Just last month the bull market had its 8th birthday, with the S&P 500 having risen over 250% from the closing low in March 2009 to the record high registered on March 1. The only other eight-year period since 1960 (as far back as we have S&P 500 data) when the market outperformed the current run was during the tech bubble of the late ‘90s. Back then the peak eight-year performance was over 300%, registered in January 1999. The age of a bull market and its magnitude, in of itself, doesn’t tell us a top is imminent, but given the precedence we are comparing the current situation to, it probably means we aren’t too far away, relatively speaking (months, maybe a year).
Price sequence suggests end is near (relatively speaking)
We took a look at this in the Q2 equity markets forecast, but we’ll have another look-see at what Elliot Wave Principle suggests. While not a hard-core practitioner of EWP, when clear five-wave sequences in major bull or bear market cycles present themselves, we pay attention. So far, the cycle since the March 2009 low has consisted of two completed impulse waves (rallies) and two corrective waves (declines), with the current rally beginning in February 2016 marking the third and final impulse wave. Three up, two down. It’s possible we have wrapped up the final leg higher, but the intermediate-term trend is still pointed squarely higher, so that will need to turn first before the tidal turn can begin.
Tops are very difficult to time, harder than bottoms. As the saying goes: Tops are a process, bottoms are an event. With further strength, a spot to look for the market to finally stall is at the upper parallel which is married to a line running up from the 2009 low. Depending on the timing of when/if its reached, the upper parallel is in the vicinity of 2550/600. Should the best days already be behind us, we’ll be watching how the market treats the lower parallel of the channel off the Feb 2016 low. The feeling on this end, is that there is more to go before we reach a high, and the decline we are undergoing now is simply a small correction in a bull market.
S&P 500: Weekly

Created with Tradingview
Valuations are historically rich, very rich
Taking a quick look at valuations, metrics are well into overvalued territory. Valuations aren’t a very good timing tool, but can provide a backdrop for conditions and expectations. Most popular metrics are highly correlated and are effectively saying the same thing – stocks are overvalued. For example, in the Q2 equity market forecast, my colleague James Stanley examined the Shiller PE ratio, which has a correlation of 89% to the one we are about to explain. (Worth noting: Current Shiller PE has only been exceeded twice, prior to the 1929 and 2000 tops.)
The metric we’re honing in on was first made popular in 2001 by Warren Buffett, and it has its variations; the one we are using is corporate equities to GDP. The numerator is ‘Nonfinancial corporate business; corporate equities; liability, Level’ with a denominator of Nominal Quarterly GDP. At 125.2% as of Q4 2016, when the latest data was made available, valuations are certainly at historically elevated levels, with only the 2000 peak holding higher valuations. They have been richer, they could get richer yet, but the conditions for a major market top are there.
‘Buffett Indicator' – Corporate Equities/GDP
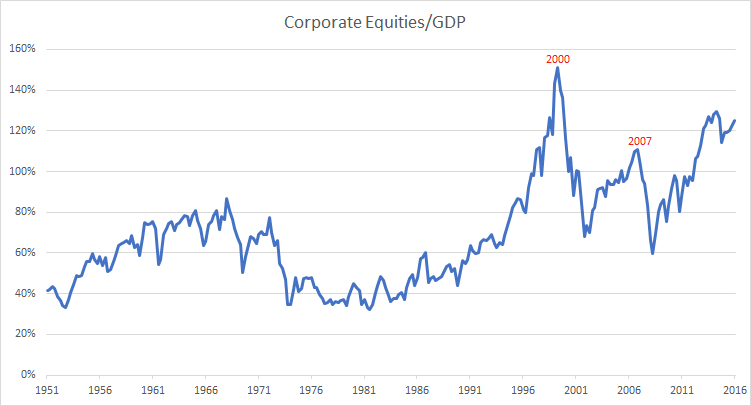
Data Source: FRED, St. Louis Fed
The decline (bear market) is likely to be big, the ‘R’ word, and the Fed
Taking into consideration the magnitude of the bull market, clear price sequence, and valuations, there is good reason to believe a major top could develop before year-end. Given the size of the run it would not be unreasonable to expect a decline of greater than 30%. Let’s put that into perspective. If we were to see a drop to the 2000/2007 peaks and use those old highs as new support, a reasonable expectation, from the most recent high that would equate to about a 35% decline. Coming from even higher levels obviously adds to the potential damage. Looking at history a bear market of this size could be considered ‘normal’ even if the market is to once again zoom to new heights after finding a bottom.
One last note, if the market experiences a decline of such magnitude it is likely the economy will fall into a recession. And while time between recessions, like the age of a bull market, doesn’t mean a recession is imminent; at almost eight years of economic growth (even as tepid as it has been at times) we are entering rare air. According to the National Bureau of Economic Research (NBER), by their count the current expansion has only been outlasted during two other periods since 1854 – 1961-1969 and 1991-2001. Indeed, we’re in rare territory. If the market and economy turn as anticipated, Yellen & Co. won't be making it too far along in the process of normalizing rates before needing to borrow those rate hikes for cuts on the way down. QE4, anyone?
See the Q2 equity markets forecast for intermediate-term expectations.
---Written by Paul Robinson, Market Analyst
You can receive Paul’s analysis directly via email by signing up here.
You can follow Paul on Twitter at @PaulRobinonFX.


