


What’s inside:
- S&P 500 isn’t providing much for the swing-trader at this point, but…
- A technical formation could give the very short-term minded an opportunity
- Levels and lines of importance outlined
See the Webinar Calendar for a schedule of upcoming live events with Paul or any of the other DailyFX analysts.
On Friday, we touched briefly on the potential for the compression in volatility in recent months to lead to a period of volatile trading ahead. Volatile trading is usually synonymous with ‘risk-off’. But before we get too excited about an uptick in broad-scale volatility we need to see price action support the notion of gyrating markets, something we have yet to see. Yesterday, the S&P and Dow both closed to new record highs, while the Nasdaq 100 just shy of fresh record levels.
The trend is up, no denying that, but risk/reward for new longs at this juncture is not desirable; but shorting into new highs isn’t an attractive approach either. From this seat, it leaves us in a state of limbo for opportunity beyond very short-term time horizons.
There may be something for the short-term trader to work with on the hourly chart, as an expanding triangle (aka 'reverse symmetrical triangle' (RST) or ‘megaphone’) has developed through the sequence of lower lows and higher highs. The expansion in price swings (as small as they may be) suggests growing instability and a potential inflection point. If the formation is to lead to a downturn, then the S&P should turn lower starting as soon as today. If the market begins to pull off, momentum will be key; should the S&P begin to decline but hold shortly thereafter, then the pattern may be in to fail as a signal of a short-term top and another leg higher could soon develop. The lower parallel extending up from the Feb 8 swing low will be viewed with interest upon any test we could see here shortly; a break below may spur the selling needed to send the market towards its first area of support in the vicinity of 2355/2351. A break below support would put the topping pattern in full swing (we’ll touch more on that later should it become relevant).
S&P 500: Hourly
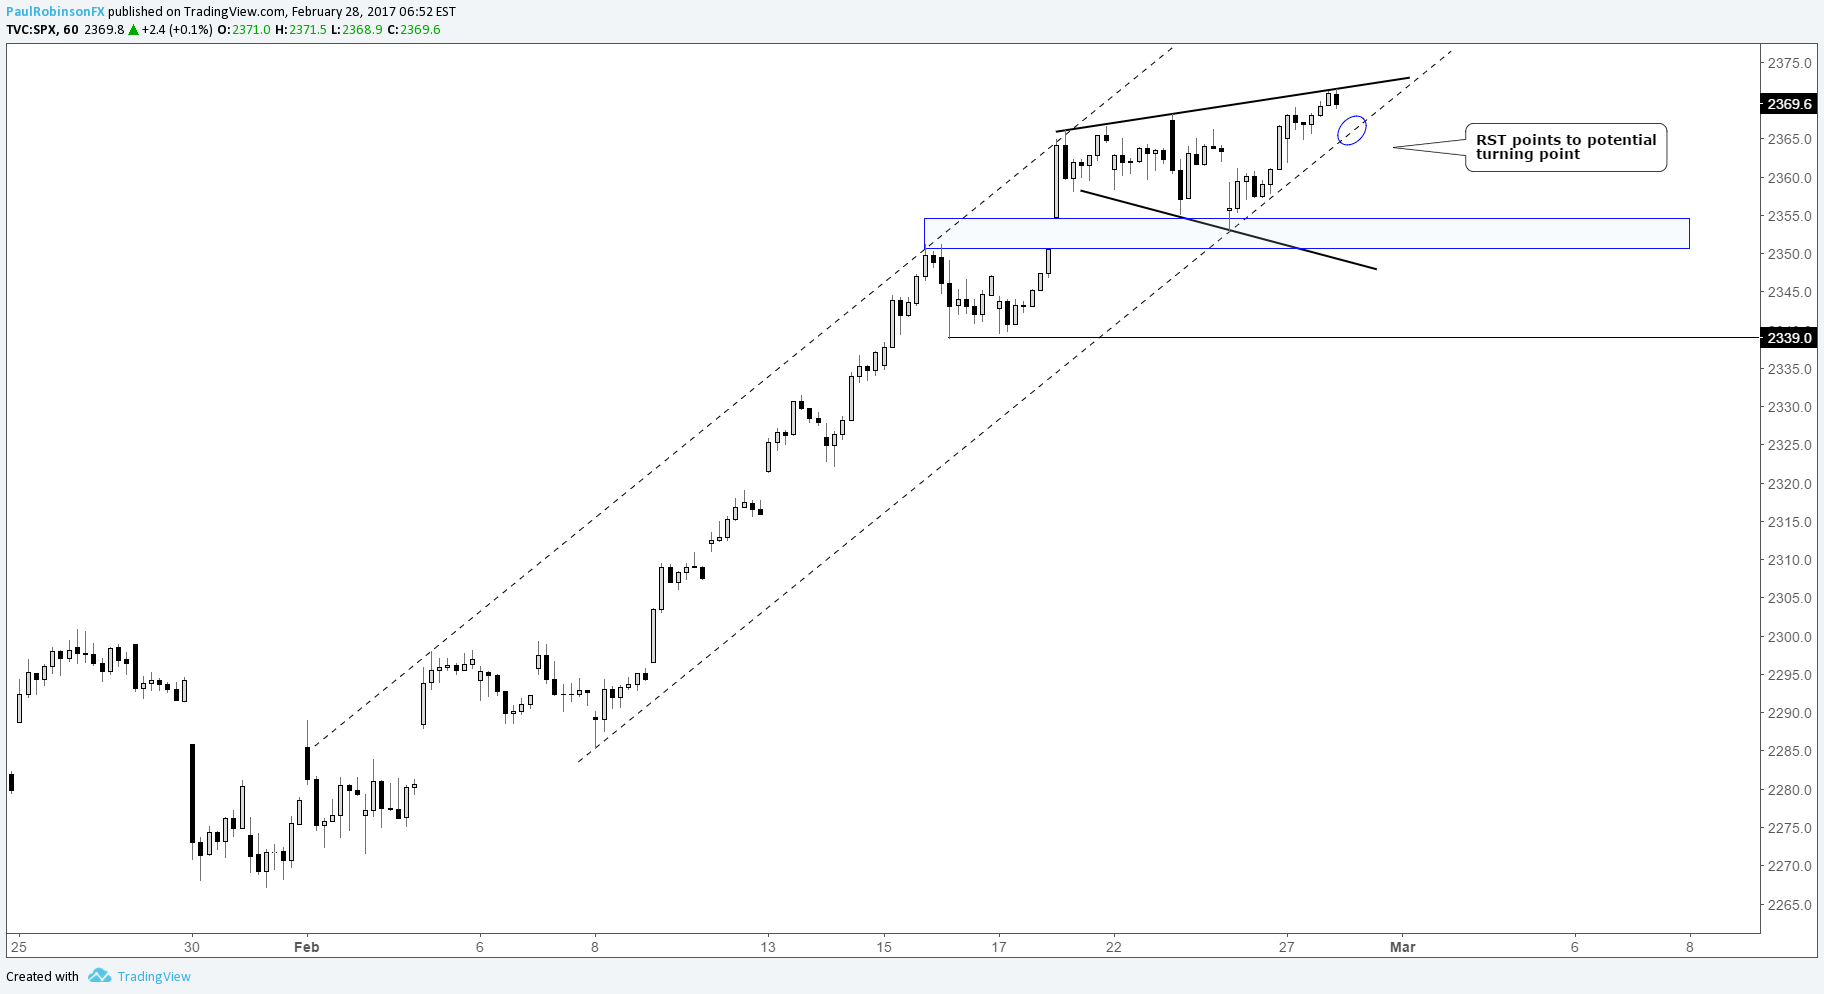
Created with TradingView
So, while volatility is low, and generally speaking there isn’t a good swing-trade out there at this time, traders with very short-term time horizons may soon find some edge to work with.
Looking for trading ideas? See our Trading Guides.
---Written by Paul Robinson, Market Analyst
You can receive Paul’s analysis directly via email by signing up here.
You can follow Paul on Twitter at @PaulRobinonFX.


