


What’s inside:
- S&P 500 reversal at new highs is a negative, at least in the short-run
- Support levels not far below, will be taking note of how the market reacts to them
- Decline initially being treated as corrective, but that could change
Earlier in the week we took a granular look at the S&P 500, and the 60-minute chart gave indications (broke below rising channel) that we could expect the pullback beginning on Monday to continue. During yesterday’s session, the market notched out a new record high by less than a point before reversing 15 handles to close at its worst levels of the day and just shy of the Tuesday low. The rejection at new highs and decline put in a bearish reversal day, suggesting more weakness is to come.
The Dow put in a small key reversal day after also reaching into new record territory. The Nasdaq 100 flat out had a tough day, dropping steadily throughout the session to finish down nearly 1.3%.
The S&P isn’t far from the previous record highs at 2194, created in August; this will act as our first level of importance to watch. The first zone of support we have penciled in extends a bit lower, though, to 2188. With some increased selling pressure, the next levels of support arrive at levels created during September between 2180 and 2169.
Recently we discussed the propensity for the market to achieve new record highs only to fail back below the prior peak within days to a couple of months. Should we see a close below 2194, this will be one of the fastest 'failures' to occur within the past three years.
It’s possible we are seeing the beginning of a larger decline unfold, but until we see an aggressive drop below support levels we will run with the notion that we are amid a corrective period. A decline below support followed by a weak attempt to rally would be our cue to change this bias.
S&P 500: Daily
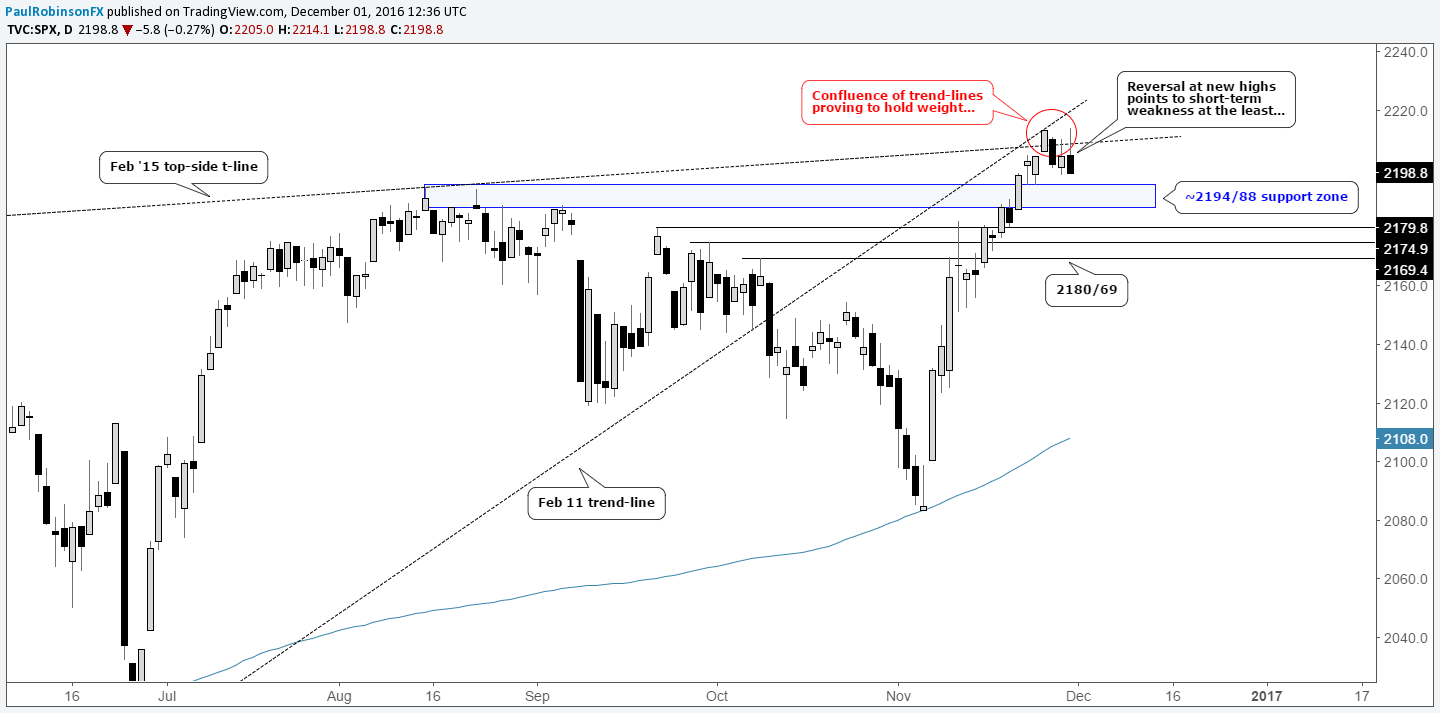
Created with Tradingview
See our Trading Guides for educational resources and forecasts. For a schedule of live events with trading outlooks, key news coverage, and educational content, please see our webinar calendar.
---Written by Paul Robinson, Market Analyst
You can receive Paul’s analysis directly via email by signing up here.
You can follow Paul on Twitter at @PaulRobinsonFX.


