


What’s inside:
- S&P continues trek higher
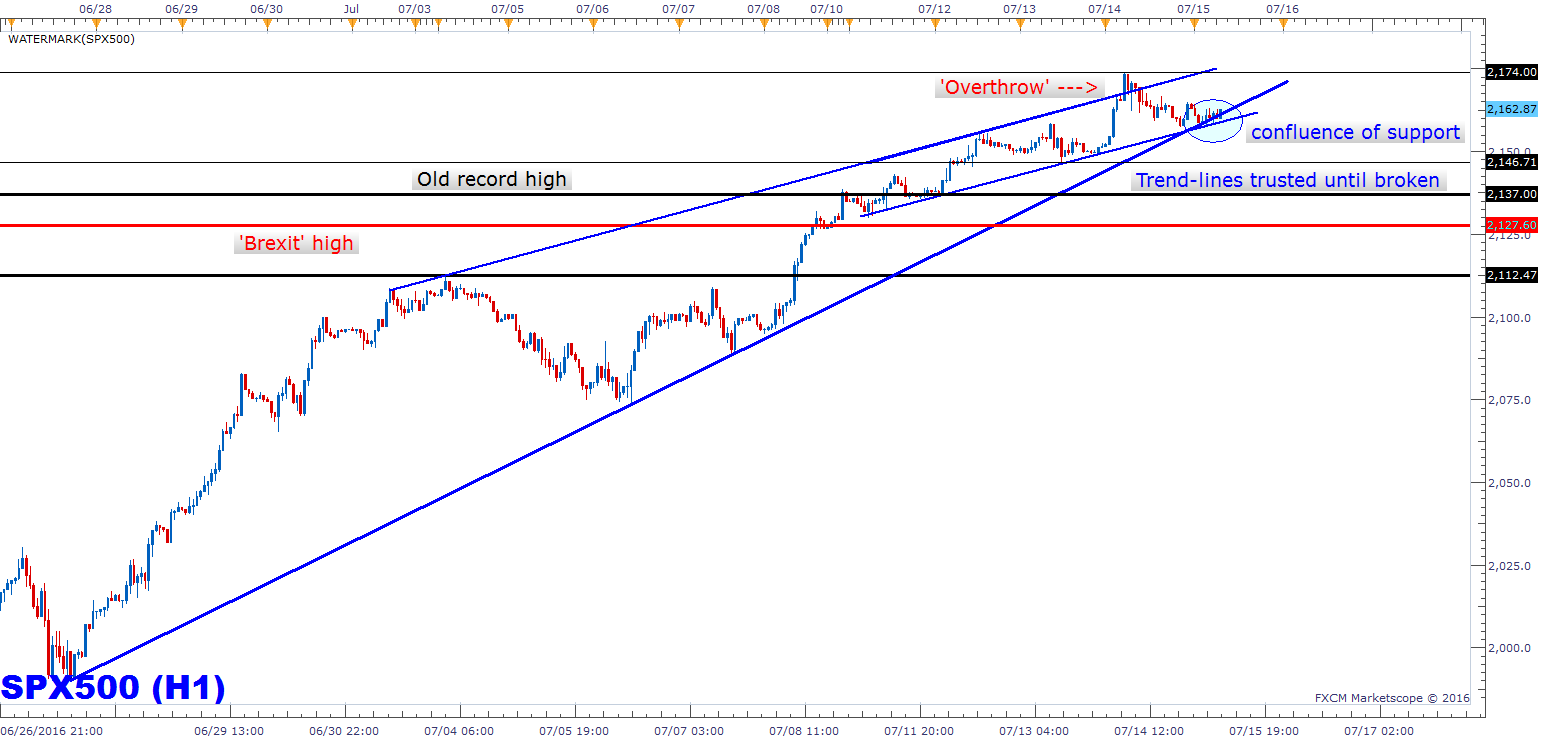
- Hourly chart in focus, two angles of trend-lines providing confluence of support
- Trend remains higher, but watch for a break to open up a larger decline; support and resistance levels outlined
The market continues to be well-bid following the breakout to new record highs in the S&P 500.These new high breakouts can make for a difficult, ‘grinding-type’ environment as buyers don’t give up and sellers are absent sans a catalyst for selling. At some point we will see a material set-back; as noted yesterday, buying new highs for an intermediate-term hold hasn’t been without its pitfalls along the way. The period we discussed was from the new record high in 2013 (above the 2007 peak) through to the highs set in May 2015. For more on that, check out yesterday’s commentary.
But until we see price action suggest a meaningful decline is underway, we will want to keep our bear claws tucked away for trades outside of short-term flips.
Looking to the hourly chart: Yesterday, we saw a short-lived overthrow of the top-side trend-line/parallel running back to the first day of the month. At the time of this writing the S&P is teetering on the trend-line off the June 27 low as well as short-term slope support (lower parallel) running back to Monday. This support will be respected until it is breached, but should we see a decline below trend support, then we will need to consider potential for some type of decline to unfold. It could be short-lived, but nevertheless a pullback.
The only significant top-side level in focus as resistance at this time is yesterday’s high at 2174. Should trend support give-way, then we will turn our attention to 2147. Below there, we will have to look to the old record highs at 2137.
Find out what separates successful traders from the rest in our trading guide, “Traits of Successful Traders”.
---Written by Paul Robinson, Market Analyst
You can follow Paul on Twitter at @PaulRobinsonFX.


