


What’s inside:
- The S&P 500 approaches top of technical pattern and record highs
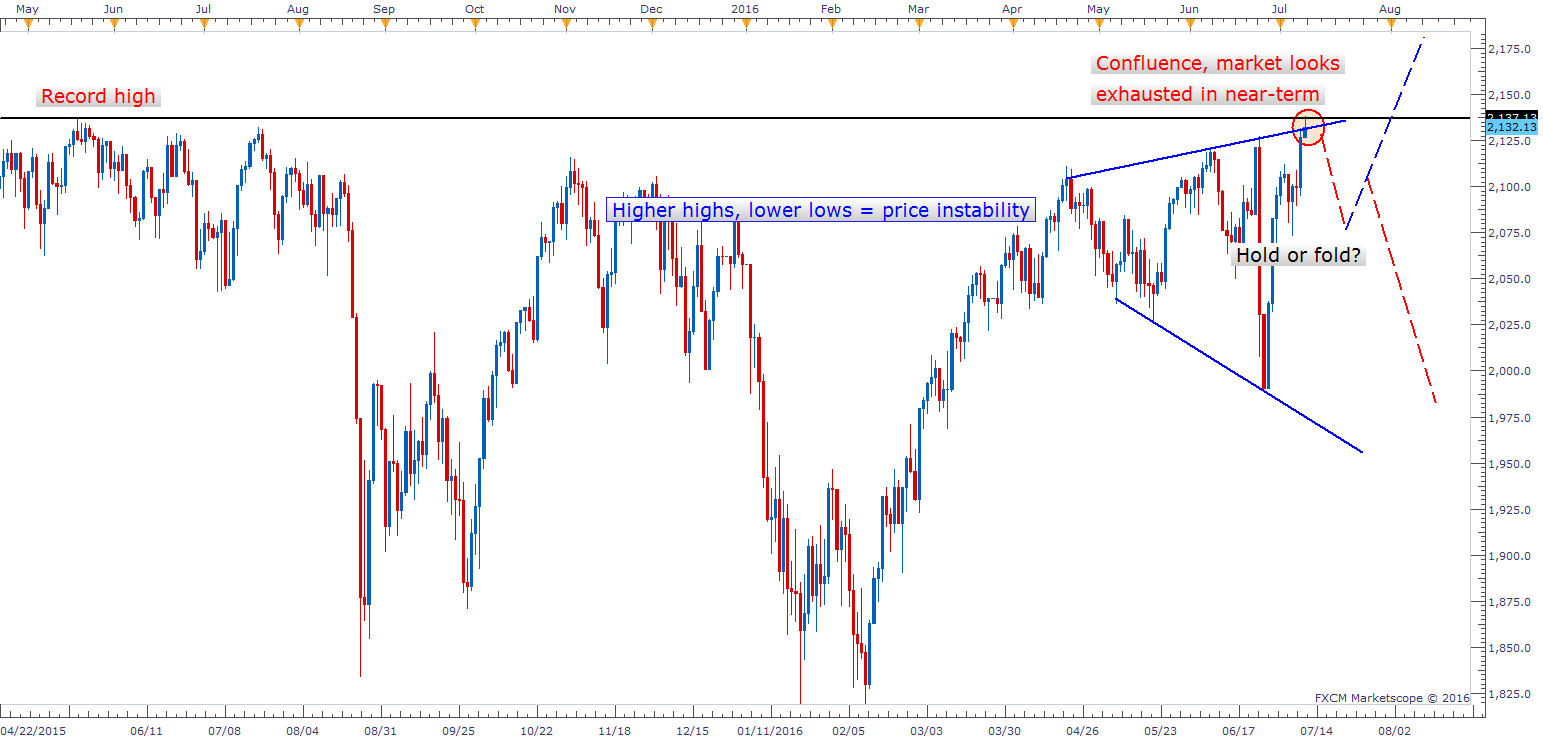
- Market looks exhausted in the short-term
- Bullish and bearish scenarios outlined
Since the April peak in the S&P 500, the market has been undergoing a period of growing instability. The price sequence over the past 2 ½ months is taking the shape of a reverse symmetrical triangle (RST), also known as a ‘megaphone’ or ‘broadening top’ formation. The increasing size in price swings is the sign of a struggle between both sides of the market.
The S&P 500 is not only at the top-side trend-line of the pattern, but also staring down the May 2015 record highs. This, at the least, skews risk towards the market pulling back from current levels. How the pullback unfolds will determine whether the RST is pointing to a full-on rout, or a shallow pullback which will eventually lead to buyers winning the battle.
The market doesn’t have to turn lower from right here at the top-side trend-line, but it would certainly make for a cleaner set-up. All formations require a reasonable amount of wiggle room.
Bearish scenario: The market declines from current levels, attempts to turn back higher, but then rolls back over, with selling intensifying quickly.
Bullish scenario: The market declines from current levels, but then turns higher and breaks above the top-side trend-line of the pattern.
The third scenario is the market continues to chug higher without any type of meaningful pullback. This seems the least likely scenario at this time given that the market appears to have exhausted itself in the short-run.
SPX500 Daily: Apr '15 to Present
Increasing the likelihood we will at least see a pullback in the near-term are the extremes seen in short-term breadth. Looking at one simple gauge: The percentage of stocks in the S&P 500 trading above the 10-day moving average climbed to over 96% on Friday, which is the highest percentage registered since the market was coming out of a bottom back in the fall of 2011. The 10-day MA is not the focus here, it is merely a yardstick by which to do a relative comparison; and with 96% of stocks trading above the 10-day, it indicates pretty much every stock in the S&P 500 has been rising, leaving little room for additional buying in the short-term.
---Written by Paul Robinson, Market Analyst
You can follow Paul on Twitter at @PaulRobinsonFX.


