


To receive James Stanley’s analysis directly via email, please SIGN UP HERE
Talking Points:
- S&P 500 Technical Strategy: Previous short cleared four targets, remainder stopped at 1,950; for the ‘big picture’ setup: one target remains for my ‘trade of the year’ at 1,750; conditional short setup identified.
- In the week after our last article, risk aversion continued until day two of Janet Yellen’s Congressional Testimony. Risk assets have remained well-bid since then.
- As we outlined in our last article, major market turns take time. With the S&P moving up by more than 10% in ~3 weeks, it would appear that the stakes are still raised for big movements later in the year.
- Short global equities is my trade of the year. To get access to these setups and more, as well as the DailyFX team’s forecasts, please click here to access our trading guides.
In our last article, we spent a bunch of words and four different charts to explain the current state of risk markets with a focus on the S&P 500. We closed that article with the current setup in the S&P 500, which at the time was yet another bear-flag formation; with a short-side setup designed to take advantage of a continued down-trend as risk aversion continued to rage in the New Year. But just after hitting that 4th target at the previous short-term low of 1,810, the pressure on global markets began to recede.
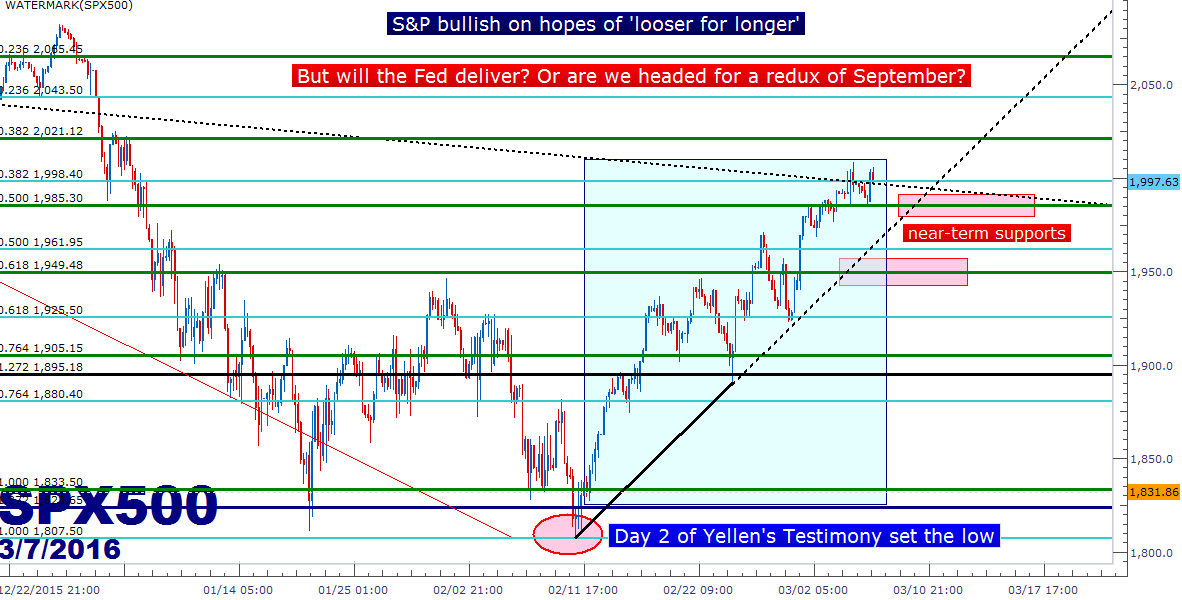
This low hit on February 11th, which was the beginning of day two of Janet Yellen’s testimony in front of Congress. In that testimony, Ms. Yellen took a stance that was largely received as being extremely dovish as we saw rate hikes for the rest of 2016 get priced-down and out of rate markets. With the removal of this pressure of impending higher rates out of the United States, a sense of normalcy has returned: Commodities have put in signs of ‘recovery,’ China appears to have taken a step back from the brink and we’re sitting in front of three major Central Bank meetings over the next two weeks, each of which can add more air to the sails of global risk cues.
Price action in the S&P since that February 11th low has been bullish and aggressive with the index moving up by nearly 11% in a little over three weeks. This is not the type of price action that one should want to directly fade: With expectations for more loose policy around-the-world, bids in equity markets have remained strong. And Central Banks may come to the table with even more loose monetary policy, and this could potentially create continued top-side movements in equity markets. After all, this has become somewhat of ‘par for the course’ in financial markets since the 2008 Financial Collapse, right?
What makes this so utterly interesting, and what provides the motive for a continued short-side thesis is the fact that the Fed may not be ready to do ‘the same ol’ thing.’ This was the thesis for my trade of the year: The Fed was ready to remove ‘emergency-like’ accommodations, and this is a major sense of support for equity markets. And sure enough, as heavier rate hikes for 2016 were expected in markets, risk aversion reigned supreme. But as markets moved lower and as the Fed provided dovish fodder for traders to chew on, prices have moved right back into their bullish ways.
But we don’t know that the Fed is going to back down yet, do we? We likely won’t be getting a hike in March judging by market expectations, but should the Fed take on a hawkish stance towards the rest of the year, similar to how they’d positioned themselves for last September’s ‘hawkish-hold,’ we can see risk aversion come right back.
Directional biases on the S&P and US equities will likely be shaped by the Fed’s stance at their next policy meeting. Market perceptions of hawkishness will likely spell weaker stock prices, while a dovish read can bring on continued strength.
The big question is whether or not the Fed is actually going to back down from rate hikes for the remainder of the year. The chart below highlights near-term support levels based off of recent Fibonacci retracements, and traders can use these levels to institute a short-side approach: Let price action break below these support levels to show that bears might be able to take control, and once that support is broken, look to sell resistance in the vicinity of old support. This can be done with levels at 1,985 and that same confluent support that we mentioned in our last article in the 1,950 zone.
The FOMC decision is on the calendar for next Wednesday (March 16th), so this may take some time to setup. For now, price action is continuing in its bullish direction; be careful of imposing a bearish approach in a bullish market. This bullish direction can change on the turn of a dime, just in the way that the bearish mood on February 11th flipped at the mention of negative rates.
Created with Marketscope/Trading Station II; prepared by James Stanley
--- Written by James Stanley, Analyst for DailyFX.com
To receive James Stanley’s analysis directly via email, please SIGN UP HERE
Contact and follow James on Twitter: @JStanleyFX


