


NZD/USD Technical ANALYSIS: BEARISH
- New Zealand Dollar support break hints 4-month upswing has ended
- Prices seem to be resuming a broader downtrend dating to July 2017
- Corrective rebound toward 0.66 may precede bearish follow-through
The New Zealand Dollar punched through support guiding the recovery against its US counterpart since the beginning of October. The break follows rejection at resistance establishing the dominant downtrend since July 2017, where the appearance of a Shooting Star candlestick marked a turning point (as expected). It suggests that a corrective rise has ended, setting the stage for the longer-term descent to resume.
Sellers now face a dense layer of back-to-back inflection point support levels in the 0.6425-96 area. A daily close below that initially exposes the 0.6322-36 zone, followed by the major 2015 bottom in the 0.6197-0.6245 region. A reversal above 2020 falling trend line support – now at 0.6614 – would probably cool immediate selling pressure. A close above 0.6756 is probably needed to confirm lasting upturn however.
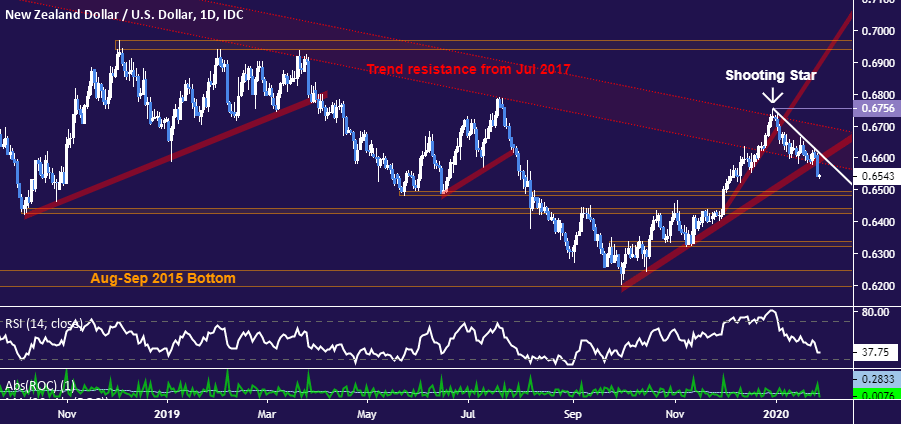
NZD/USD daily chart created using TradingView

Turning to the hourly chart warns against over-extrapolating scope for near-term weakness. The appearance of a bullish Morning Star candlestick pattern followed by a break above resistance guiding the downswing since early Friday (January 24) suggests NZD/USD might retrace higher before the broader decline is re-engaged in earnest. Initial support-turned-resistance is in the 0.6578-82 price band.
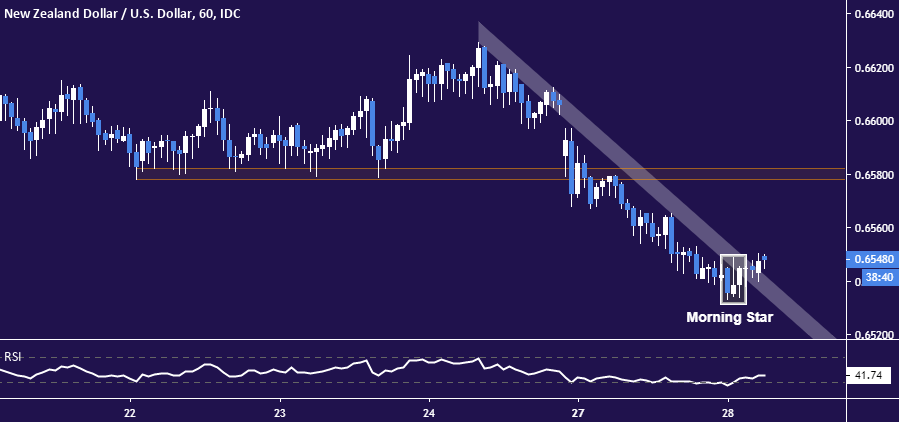
NZD/USD 60-minute chart created using TradingView
NZD/USD TRADER SENTIMENT
| Change in | Longs | Shorts | OI |
| Daily | 6% | -13% | 2% |
| Weekly | 40% | -35% | 15% |
NZD/USD TRADING RESOURCES
- Just getting started? See our beginners’ guide for FX traders
- Having trouble with your strategy? Here’s the #1 mistake that traders make
- Join a free live webinar and have your trading questions answered
--- Written by Ilya Spivak, Currency Strategist for DailyFX.com
To contact Ilya, use the Comments section below or @IlyaSpivak on Twitter


