


NZD/USD Technical ANALYSIS: BEARISH
- New Zealand Dollar rally rejected at long-term resistance
- Sellers on the verge of 1-month NZD/USD uptrend break
- Back-to-back support levels lining up to slow the decline

The New Zealand Dollar may be on the verge of resuming the dominant downtrend against its US counterpart. Prices tumbled after putting in a telltale Shooting Star candlestick squarely at the outer layer of resistance guiding them downward since July 2017. They are now on course to break the bounds of the rise from late November, setting the stage for deeper losses ahead.
Confirmation of a bearish breach secured on a daily closing basis broadly shifts the spotlight to a cluster of overlapping support levels in the 0.6425-96 area. Pushing back below that would neutralize the upward trajectory established from the October 1 swing low, convincingly painting gains in the fourth quarter of 2019 as corrective within a structural decline telegraphed in longer-term positioning.
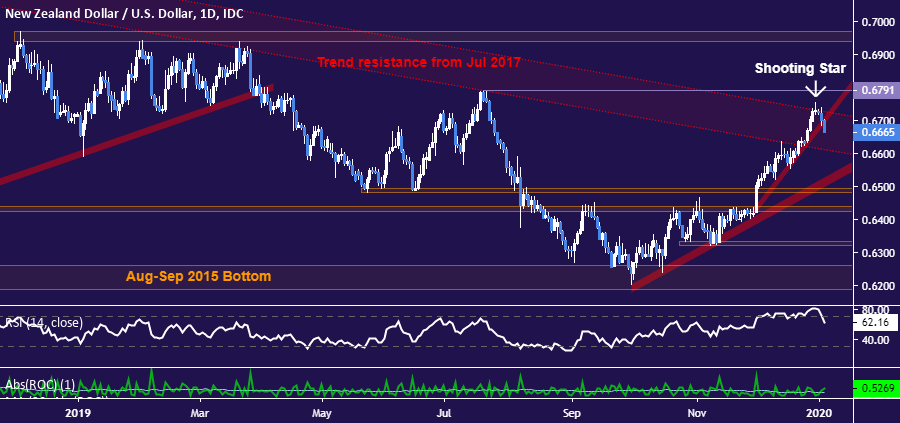
NZD/USD daily chart created using TradingView
The way lower toward this critical threshold looks far from simple however. Zooming in to the four-hour chart shows the one-month uptrend appears broken but back-to-back support levels now line up as roadblocks to downward progress. Former resistance in the 0.6636-48 zone is followed by a rising trend line at 0.6610, then a chart inflection point at 0.6576. These might make finding an attractive near-term short entry setup challenging on risk/reward grounds.

NZD/USD 4-hour chart created using TradingView
| Change in | Longs | Shorts | OI |
| Daily | -7% | -14% | -9% |
| Weekly | 7% | -10% | 2% |
NZD/USD TRADING RESOURCES:
- Just getting started? See our beginners’ guide for FX traders
- Having trouble with your strategy? Here’s the #1 mistake that traders make
- Join a free live webinar and have your trading questions answered
--- Written by Ilya Spivak, Currency Strategist for DailyFX.com
To contact Ilya, use the Comments section below or @IlyaSpivak on Twitter


