


NZD/USD Technical ANALYSIS: BEARISH
- New Zealand Dollar inching toward a test of 3-monh trend support
- Confirmed breakdown may mark start of bearish trend resumption
- Long-term chart setup seems tilted to favor a broadly bearish bias
The New Zealand Dollar is grinding lower as expected after producing a Shooting Star candlestick at bearish trend resistance set from July 2017. A break below support defining December’s month-long rise has now been followed by a breach of former resistance at 0.6636, seemingly setting the stage for a challenge of the upward-sloping barrier defining the recovery from late-September lows.
How prices behave at this barrier might prove trend-defining. If buyers manage to defend it, another foray higher to test the bounds of the long-term downtrend may follow. A break below it – with confirmation on a daily closing basis – would suggest that a corrective rise has been exhausted and set the stage for bearish resumption. A dense support block in the 0.6425-96 region follows immediately thereafter.
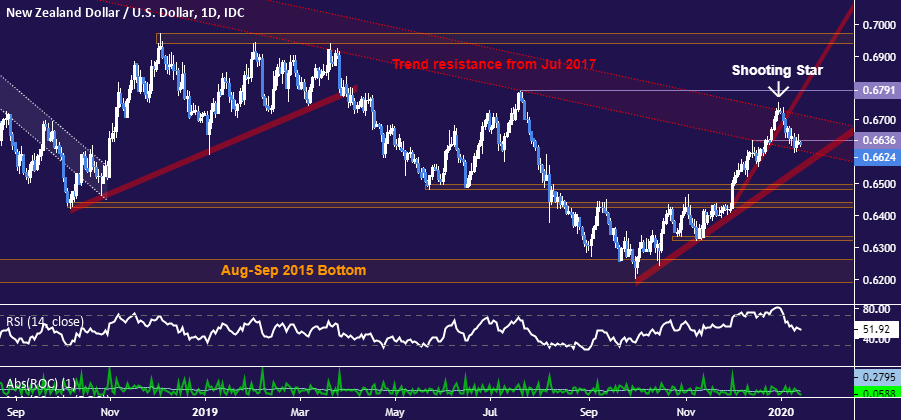
Daily NZD/USD chart created using TradingView

A look at longer-term positioning on the monthly chart seemingly suggests the path of least resistance favors the downside. Recent NZD/USD gains appear as a retracement after the pair broke the bounds a nearly two-decade-long advance and landed atop the long-standing 0.5914-0.6197 congestion zone. With key resistance having now held up to retest in December, the time to re-engage the trend may reasonably be at hand.
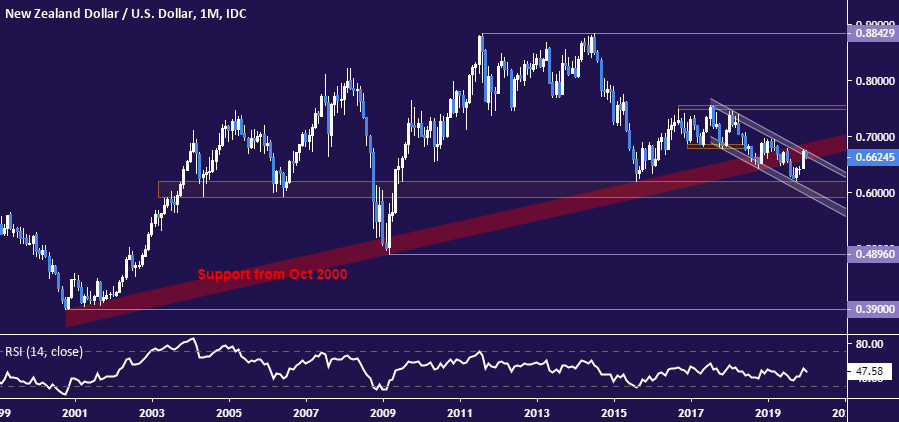
Monthly NZD/USD chart created using TradingView
NZD/USD TRADER SENTIMENT
| Change in | Longs | Shorts | OI |
| Daily | 6% | -13% | 2% |
| Weekly | 40% | -35% | 15% |
NZD/USD TRADING RESOURCES:
- Just getting started? See our beginners’ guide for FX traders
- Having trouble with your strategy? Here’s the #1 mistake that traders make
- Join a free live webinar and have your trading questions answered
--- Written by Ilya Spivak, Currency Strategist for DailyFX.com
To contact Ilya, use the Comments section below or @IlyaSpivak on Twitter


