NZD/USD Technical Analysis: Struggling to Get Below 2009 Support
- The New Zealand Dollar stalled its descent multiple times now on the March 2009 line
- Another bullish reversal pattern has formed, but this time on the daily chart. Watch it
- A pullback to resistance may lack momentum as former support reestablishes itself
Just getting started trading the New Zealand Dollar? See our beginners’ guide for FX traders to learn how you can apply this in your strategy!
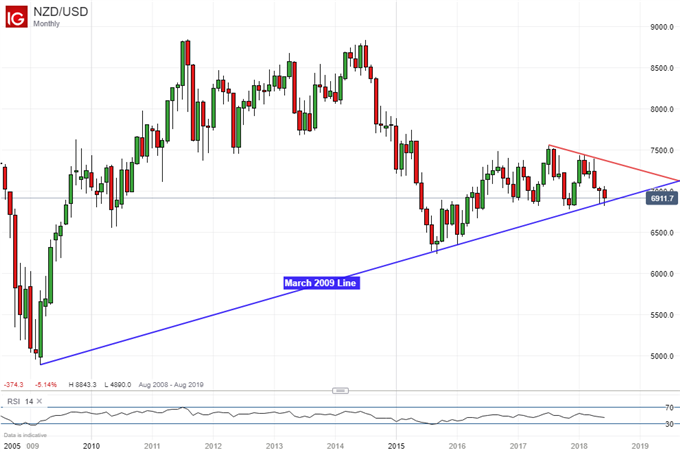
Last time we looked at the New Zealand Dollar, we noted a couple of warning signs that the pair was about to turn higher. NZD/USD followed through but it was not long until the pair reversed lower after losing momentum. For now, the long-term rising trend line noted on the monthly chart below is still in play and the pair has a couple of key obstacles to overcome if it wants to keep descending.

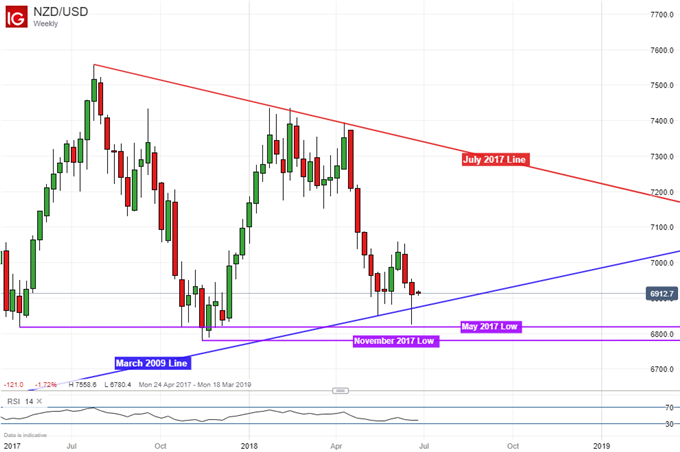
Zooming in on the weekly chart, you will note that the Morning Star bullish reversal pattern formed back in late-May failed to generate much follow-through and the downtrend since mid-April appears to be trying to resume course. Though at this point, we still do not have a weekly close below the March 2009 line. Instead, Kiwi Dollar tested horizontal support from May 2017.

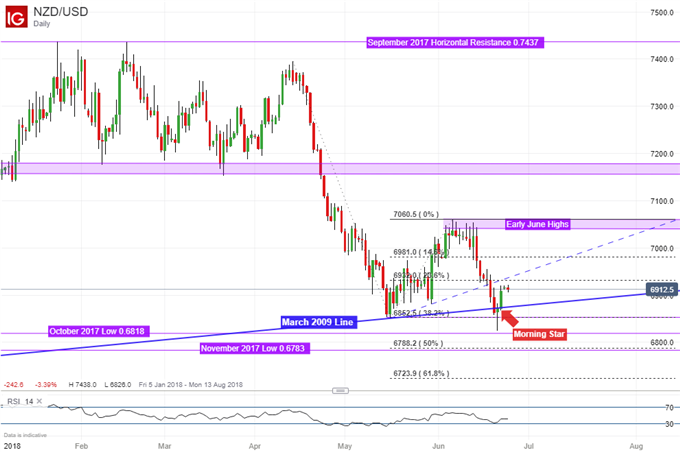
Looking at the daily chart gives us a better picture of what has been going on around those key support areas. Now, another morning star has formed and warrants close attention as this could mean the pair may turn higher in the near-term. In fact, prices were unable to close below the May 16th low at 0.6852 and they stalled just above 0.6818 at one point.
All of this points to very stubborn and well-established floors that the pair will have to fall through before we can confirm that NZD/USD is heading for a lasting continuation of its downturn from mid-April. Nevertheless, a break below support (which is closely aligned with the 50% Fibonacci extension at 0.6788) opens the door to test the 61.8% level at 0.6723. At that point, we are looking at 2016 lows.
On the other hand, a turn higher that confirms that morning star has the 23.6% extension as immediate resistance at 0.6932. A break above that opens the door to test a near-term rising support line from mid-May which could act as new resistance. Beyond that lies the 14.6% minor level at 0.6981.

NZD/USD Trading Resources:
- Join a free Q&A webinar and have your trading questions answered
- See how the New Zealand Dollar is viewed by the trading community at the DailyFX Sentiment Page
- Having trouble with your strategy? Here’s the #1 mistake that traders make
--- Written by Daniel Dubrovsky, Junior Currency Analyst for DailyFX.com
To contact Daniel, use the comments section below or @ddubrovskyFX on Twitter


