


NZD/USD Technical Analysis: Recent Descent at Risk?
- The New Zealand Dollar stalled on the March 2009 line and is trying is push higher
- A morning star bearish reversal pattern still needs confirmation on the weekly chart
- NZD/USD faces 0.7059, 0.7123 and 0.7187 next. Below it is 0.6930 and the trend line
Just getting started trading the New Zealand Dollar? See our beginners’ guide for FX traders to learn how you can apply this in your strategy!
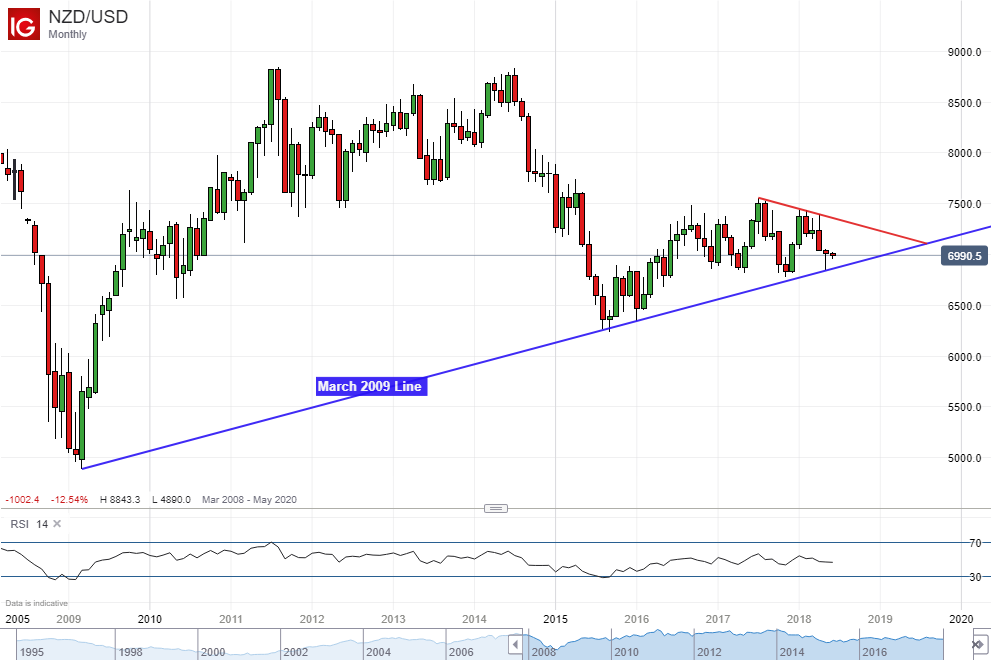
The New Zealand Dollar could be aiming higher against its US counterpart amidst warning signs on the monthly, weekly and daily charts. Starting the with the first one, on the immediate chart below, NZD/USD has now been tamed on multiple occasions in attempts to push lower since 2009. Connecting these instances together forms a rising trend line from March 2009. The most recent failed push was in May.
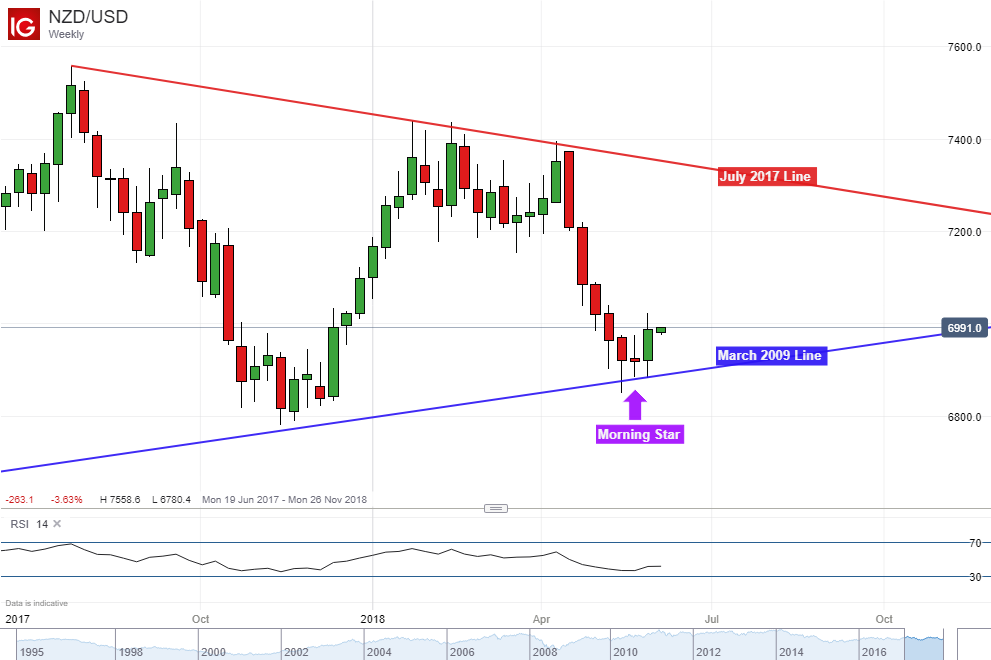
Zooming in, we take a look at the weekly chart. Something interesting has formed on the March 2009 line, a Morning Star. This is a bullish reversal patterns. While it warns that NZD/USD may be turning higher, confirmation will be needed as the pattern itself only indicates indecision. Another weekly close higher could be just that. If it is going to ascend, the dominant downtrend since mid-April/earl-May could be at risk.
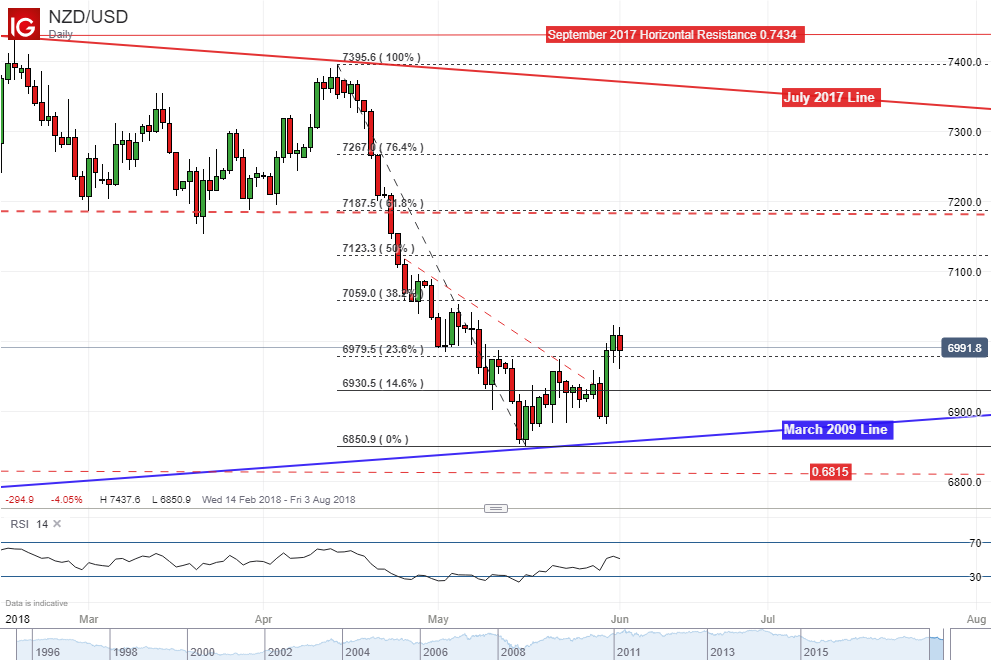
Now let us take a look at the daily chart to see what prices have to overcome to get us that confirmation. We just had a close above the 23.6% Fibonacci retracement at 0.6979. From here, immediate resistance is the 38.2% level at 0.7059. A push above that exposes the 50% midpoint followed by the 61.8% retracement at 0.7187. The latter is also closely aligned with horizontal support that kept NZD/USD elevated for the first four months of 2018. It could come back to act as new resistance.
On the other hand, if the pair falls below immediate support, then the 14.6% minor level could be the next target at 0.6930. A break below that exposes the March 2009 line followed by the May 16 low at 0.6850 (also the current 2018 low).
If NZD/USD is indeed trying to climb in the days and even weeks ahead, the pair may eventually find itself retesting the July 2017 descending line. If it fails, then perhaps the rest of this year could just be NZD/USD consolidating between that and the March 2009 line.
NZD/USD Trading Resources:
- Join a free Q&A webinar and have your trading questions answered
- See how the New Zealand Dollar is viewed by the trading community at the DailyFX Sentiment Page
- Having trouble with your strategy? Here’s the #1 mistake that traders make
--- Written by Daniel Dubrovsky, Junior Currency Analyst for DailyFX.com
To contact Daniel, use the comments section below or @ddubrovskyFX on Twitter


