To receive Ilya's analysis directly via email, please SIGN UP HERE
Talking Points:
- NZD/USD Technical Strategy: Flat
- Kiwi Dollar stumbles at 16-month high below 0.75 figure vs. USD
- Waiting for actionable risk/reward opportunity to enter short trade
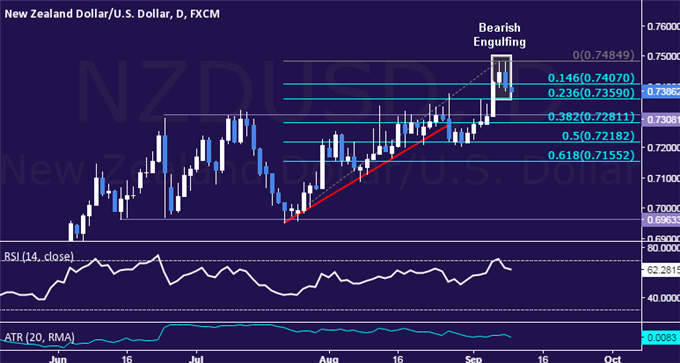
The New Zealand Dollar may be preparing to turn lower against its US namesake after prices advanced to the highest level in nearly 16 months. The pair posted the largest one-day gain since late July but follow-through ahead of the 0.75 figure, yielding to the formation of a Bearish Reversal candlestick pattern.
Near-term support is now at 0.7359, the 23.6% Fibonacci retracement, with a break below that on a daily closing basis opening the door for a test of the 0.7281-0.7308 area (38.2% level, horizontal pivot). Alternatively, a move back above the 14.6% Fib at 0.7407 paves the way for a challenge of the September 7 high at 0.7485.
While entering short is a generally compelling proposition, current positioning is unattractive. Prices are too close to support to justify a short trade from a risk/reward perspective. The immediately available trading range is also too narrow relative to average volatility (as measured by ATR). Standing aside seems prudent.
What do past NZD/USD price patterns hint about current trends? Find out here !