


Talking Points:
- Index broke above the 16,000 handle before finding resistance
- The 16,500 handle proved influential in the past and price respected the level again for resistance
- Gains appearing to be corrective in the context of the near term down
If you’re looking for trading ideas, check out our Trading Guides Here
The Nikkei 225 has edged slightly lower after finding resistance at the 16,500 level following a rise on the backdrop of the Japanese elections.
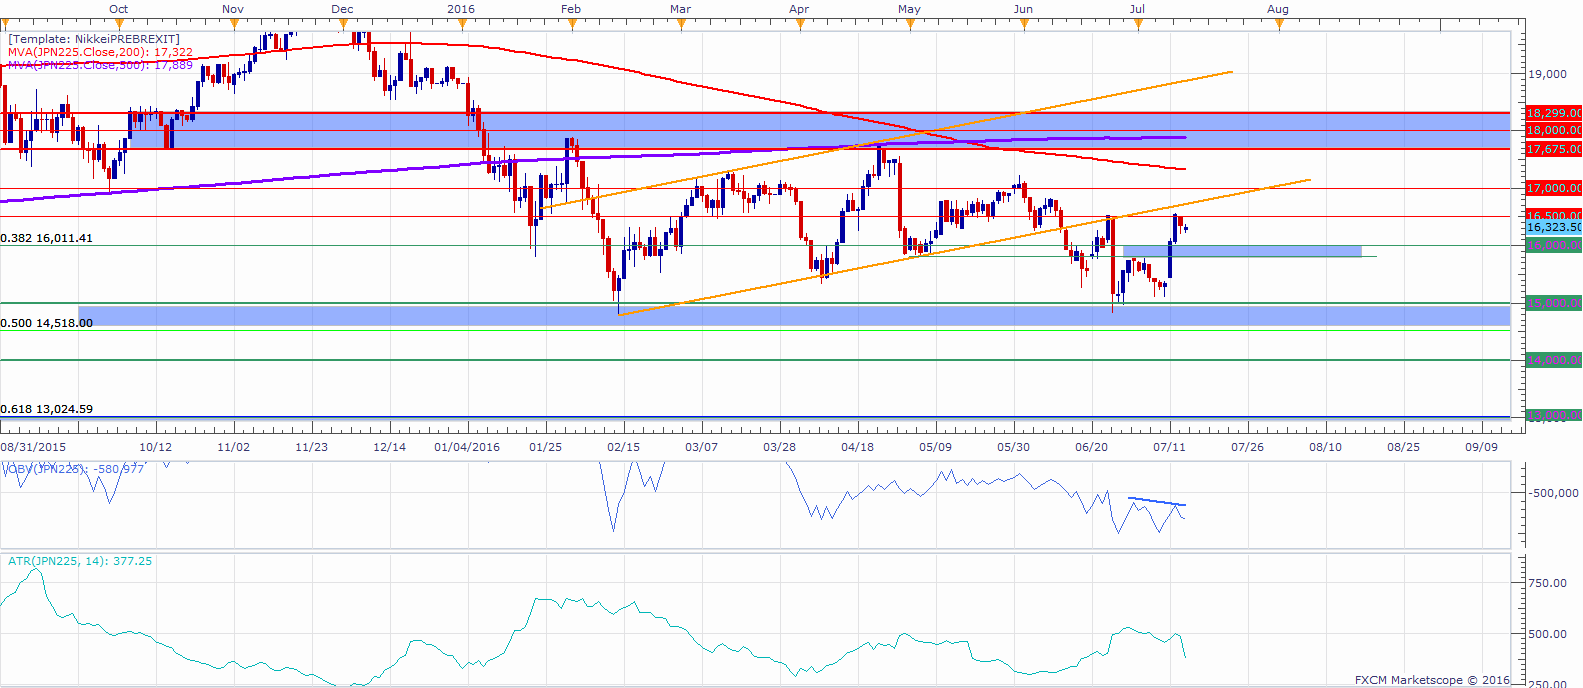
The index bounced from an area of support between the 0.50 Fib at 14,518 (As was drawn for the last monthly leg higher from the June 2012 low at 8,190 to the June 2016 high at 20,961) and the 15,000 handle, and managed to break a short term resistance area between 15,800 to the 16,000 handle.
Upon hitting the 16,500 level, the index saw a slight move to the downside as the level appeared to have acted as resistance. The 16,500 figure is at about 50% of the 2016 trading range and seemed influential in the past for deciding short term directional conviction.
The price has been ranging between the well-defined 18,000 resistance zone and the 15,000 support since the start of the year, with gains appearing to be corrective in the context of the near term down trend from June 2015 highs. OBV is showing a slight short term divergence on the latest bounce higher.
At this stage, the move to the upside might need to see a break above 16,500 and a possible broken trend line resistance in order to threat the 2016 highs.
A move below the 16,000 area, might put the focus on the 15,000 range lows once again.
Nikkei 225 Daily Chart: July 14, 2016
--- Written by Oded Shimoni, Junior Currency Analyst for DailyFX.com
To contact Oded Shimoni, e-mail oshimoni@dailyfx.com


