GBP/USD Technical Outlook
- Cable is digesting the recent rise off the low in bullish fashion
- Another leg higher looks likely to come in the near-term


GBP/USD Technical Analysis: Another Leg Higher Looking Likely
Cable ran off the May lows in conjunction with a reversal in risk trends, as the dollar sank and stocks ripped. While correlations have cooled since the low, it still exists and as long as stocks look headed higher and the dollar lower, then GBP/USD should maintain a bid.
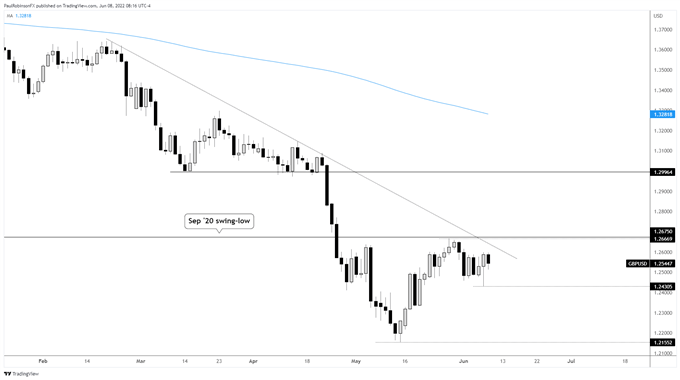
Yesterday, cable tried to fall out of a short-term range, but then in strong fashion rebounded to close the sessions near the highs. This has it set up to run higher soon as long as yesterday’s low at 12430 holds up.
Looking higher, just ahead lies a trend-line from February that could keep price contained on an immediate test, but it isn’t expected to hold cable down for long. The first meaningful level we will need to see crossed clocks in at 12667/75. This is the recent peak just under a swing-low created in September 2020.
If risk is to continue higher as anticipated in the near-term, then this level is likely to break, however; it could act as a cap if the general dollar down/stocks up phase is cut short. A rejection around resistance would be cause for concern on the downside, and open up a potential opportunity for shorts.
If, however, resistance is crossed and can go from acting as resistance to becoming support then would-be longs may find themselves with an opportunity for trade back up towards the 12900/13000 area while having a floor to work with for stops.
GBP/USD Daily Chart

Resources for Forex Traders
Whether you are a new or experienced trader, we have several resources available to help you; indicator for tracking trader sentiment, quarterly trading forecasts, analytical and educational webinars held daily, trading guides to help you improve trading performance, and one specifically for those who are new to forex.
---Written by Paul Robinson, Market Analyst
You can follow Paul on Twitter at @PaulRobinsonFX


