


GBP/USD Technical Outlook
- Cable broke a trend-line and congestive pattern
- Overall, though, quite heavy with trend/tone negative

GBP/USD Technical Analysis: Snapping Downtrend May Prove Difficult
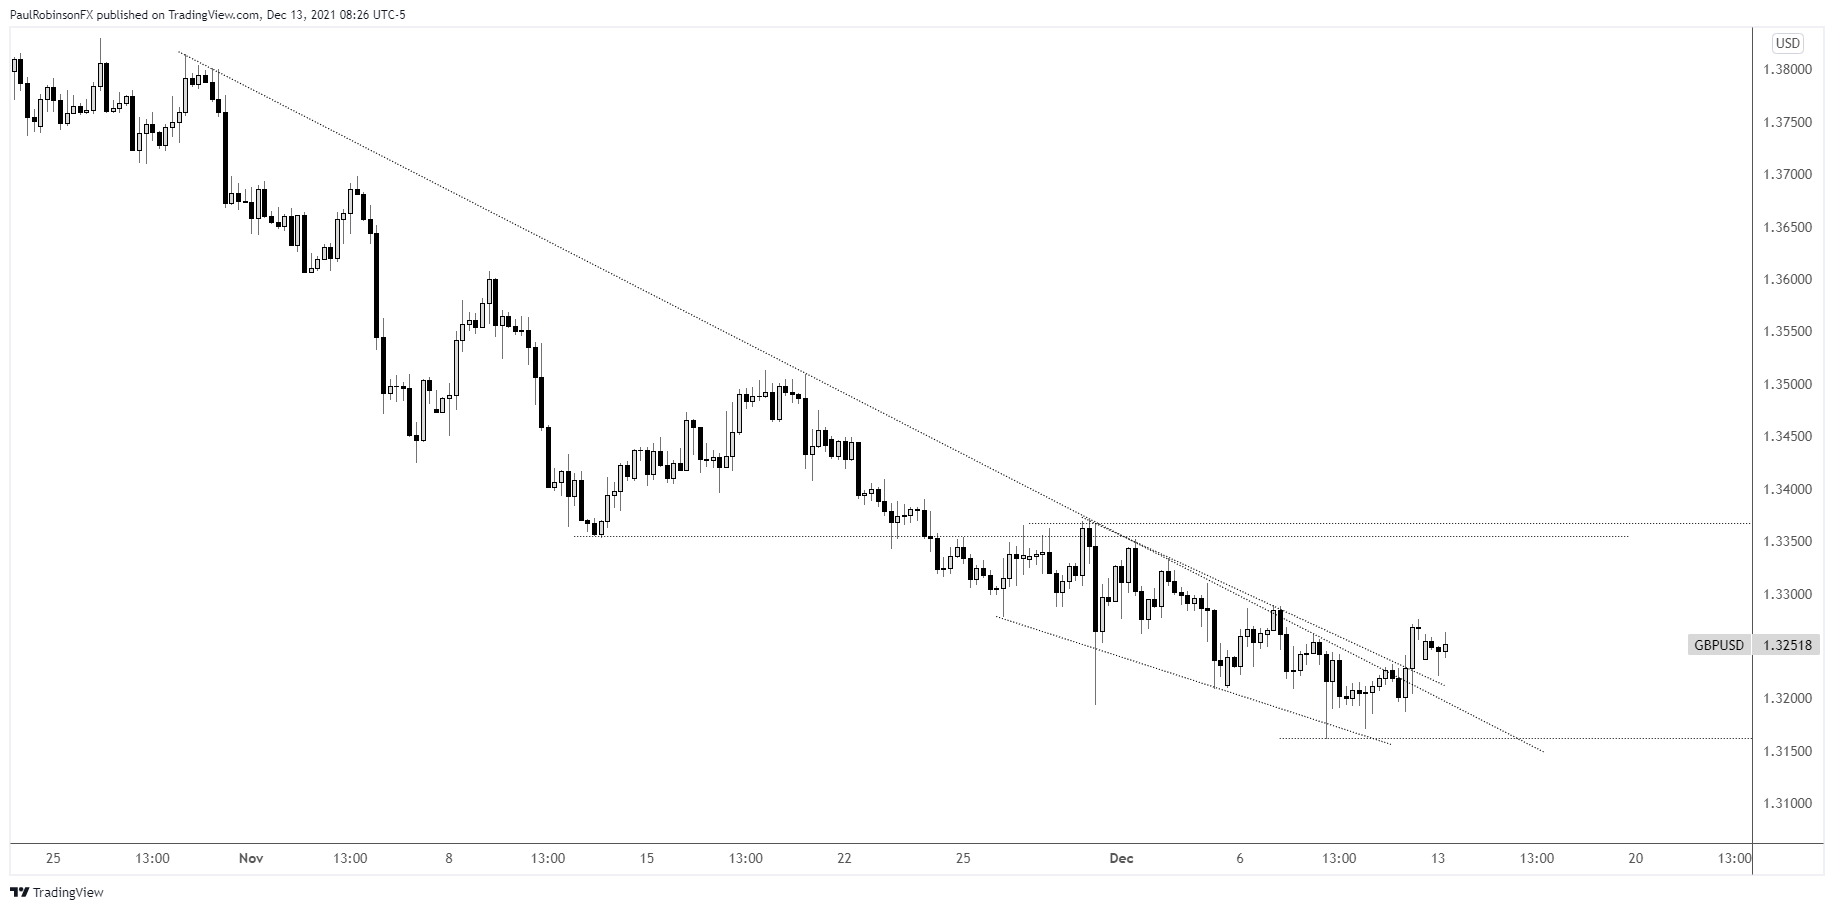
Cable is trying to turn the corner and at least recover from the depts of the past couple of months’ worth of selling, but that may prove difficult as the year draws towards its conclusion. The past couple of weeks brought a slowing in downward momentum that made for a falling wedge type pattern.
The break out of the pattern on Friday and rally above a six week trend-line hinted towards the idea that we may see GBP/USD recover above the lower parallel from July and rally a bit from here. It still may, but it will need to get into gear soon or else the generally poor tone and downward trend will prove to be too much to turn things around.
In the event we see price hold above the trend-lines from early November and the wedge, we could see Cable rally towards the 11/30 high, 11/10 low. The area around 13360 has proven itself as a meaningful level to watch. Perhaps a rally to this point is all that can develop, but if not a break above could ignite more strength.
If Friday’s break turns out to be nothing more than a blip in the context of the ongoing downtrend, then the first level to watch for invalidation of the trend-line break is the recent low at 13161. There is a minor level at 13134, followed by another minor level at 12853.
GBP/USD Daily Chart

GBP/USD 4-hr Chart
Resources for Forex Traders
Whether you are a new or experienced trader, we have several resources available to help you; indicator for tracking trader sentiment, quarterly trading forecasts, analytical and educational webinars held daily, trading guides to help you improve trading performance, and one specifically for those who are new to forex.
---Written by Paul Robinson, Market Analyst
You can follow Paul on Twitter at @PaulRobinsonFX


