


GBP/USD Technical Outlook
- Gradual chopping decline since Feb smacks of corrective behavior
- Bull-flag coming into view that could soon trigger
- A breakdown to 13500 would still leave longer-term outlook intact
GBP Technical Forecast: GBP/USD Charts Looking Increasingly Bullish
The gradual choppy decline that has been developing in GBP/USD is taking on the shape of a bull-flag that could soon trigger towards another leg higher within the context of an uptrend off the March 2020 panic low.
If this is to be the case, then a rally could commence at any time. There is good support at the feet of cable via a slope from May, which is viewed as a line-in-the-sand between here and a massive support test by way of the 2009 low.
Before getting to the 13500 test scenario, if the bull-flag breaks soon, a rise above the most recent pivot high at 13919 will help confirm that indeed a new bull leg is trying to gain momentum. This would snap the lower-high/lower-low sequence that is inherent to bull-flag patterns.
From there the first targeted level would be the Feb high at 14241, but if the bull trend is to continue then higher prices from there are anticipated.
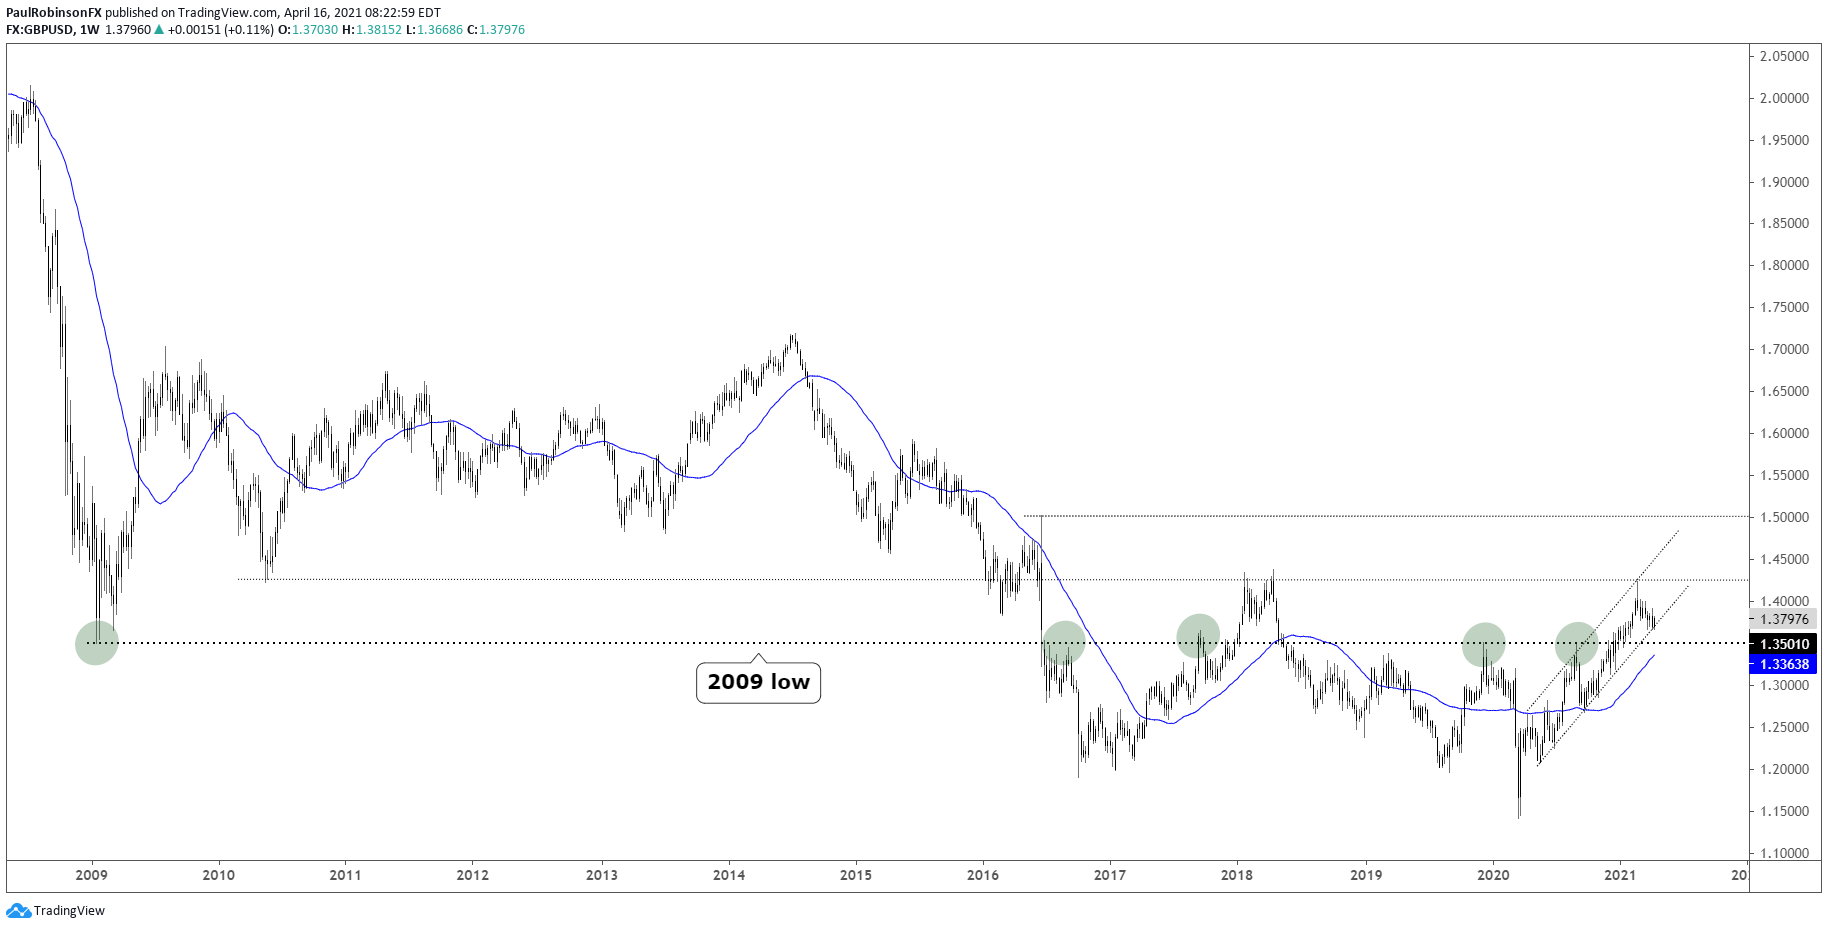
Backing up to the scenario where the slope doesn’t hold as support, we could see a move to the 13500 level. This would be a major development as this is the 2009 low, and has been validated as a level of meaning on four occasions since 2016. Most recently in 2019 and 2020 it acted as a meaningful level of resistance.
A drop to that point could offer up a strong risk/reward trade from the long-side as old resistance will be viewed as a potential source of support. But for now, as long as the slope holds then the bull-flag on the daily is in play. The coming days and weeks look like they will be pivotal for the broader outlook in cable.

GBP/USD Daily Chart (bull-flag, slope support)

GBP/USD Weekly Chart (13500 big level)
Resources for Forex Traders
Whether you are a new or experienced trader, we have several resources available to help you; indicator for tracking trader sentiment, quarterly trading forecasts, analytical and educational webinars held daily, trading guides to help you improve trading performance, and one specifically for those who are new to forex.
---Written by Paul Robinson, Market Analyst
You can follow Paul on Twitter at @PaulRobinsonFX


