


British Pound Outlook:
- At first glance, there’s no clear direction across the GBP-complex, with each of the major GBP-crosses telling a different story.
- GBP/USD looks the least healthy, while GBP/JPY appears to want to try for higher levels and EUR/GBP teeters on the precipice of another leg lower.
- Recent changes in retail trader positioning suggest a mostly bullish bias for the British Pound.
It’s Been a Sterling Quarter
The post-Brexit period has brought little but relief for the British Pound. Unmoored from the European Union’s disjointed and pedantic vaccination efforts, the UK has surged ahead to have one of the highest vaccination rates in the world (behind Chile, Israel, and the UAE, and still ahead of the US). Even as some concerns arise about vaccination supplies due to shifts in EU export policy, the UK economy appears to remain on track to return to its pre-pandemic output faster than most other developed economies.
It is against this backdrop that the British Pound is closing out a rather sterling quarter, whereby even the recent pullback in GBP/USD rates has failed to take off the shine. Even as GBP/USD looks the least healthy of the major GBP-crosses, there’s a different story to be told by EUR/GBP and GBP/JPY rates: the success achieved in 1Q’21 is poised to continue heading into 2Q’21

GBP/JPY RATE TECHNICAL ANALYSIS: DAILY CHART (November 2019 to March 2021) (CHART 1)

In the prior GBP/JPY rates forecast update, it was noted that “GBP/JPY rates are starting to carve out a potential sideways channel against the yearly high, which in context of the preceding price action would suggest a bull flag is forming. This may portend to a period of directionless churn for the next several sessions, if not into the middle of the month.”
GBP/JPY rates remain in a relative ascending channel dating back to late-February, although price action through March has been constrained around a multitude of key levels: the 76.4% Fibonacci retracement of the 2018 high/2020 low range at 148.91; the 2019 high at 148.87; and the 38.2% Fibonacci retracement of the 2015 high/2020 low range at 151.45. Despite little progress made over the past two weeks, the pair remains well-positioned for more gains, with the charts having digested some of the extreme bullish momentum readings seen earlier in the month.
Nevertheless, in light of the pullback and bounce (late-March has produced V-shaped price action), GBP/JPY rates are still above their daily 5-, 8-, 13-, and 21-EMA envelope, which is in bullish sequential order. Daily MACD’s pullback above its signal line appears to be ending, while daily Slow Stochastics have recently ascended through their median line into bullish territory. More gains may be ahead yet.

IG Client Sentiment Index: GBP/JPY Rate Forecast (March 30, 2021) (Chart 2)

GBP/JPY: Retail trader data shows 35.31% of traders are net-long with the ratio of traders short to long at 1.83 to 1. The number of traders net-long is 5.19% lower than yesterday and 5.35% higher from last week, while the number of traders net-short is 6.59% higher than yesterday and 9.84% higher from last week.
We typically take a contrarian view to crowd sentiment, and the fact traders are net-short suggests GBP/JPY prices may continue to rise.
Traders are further net-short than yesterday and last week, and the combination of current sentiment and recent changes gives us a stronger GBP/JPY-bullish contrarian trading bias.
GBP/USD RATE TECHNICAL ANALYSIS: DAILY CHART (FEBRUARY 2020 TO MARCH 2021) (CHART 3)

GBP/USD rates are the least appealing of the major GBP-crosses, insofar as the strength in the US Dollar (via the DXY Index) suggests that this particular pair may be susceptible to more weakness. GBP/USD has recently lost the uptrend from the March and November 2020 lows, with price action the past three days resolving itself in a bearish manner – an evening star candle cluster, treating the pandemic trendline as resistance.
The key test is arriving at the 76.4% Fibonacci retracement of the 2018 high/2020 low range at 1.3677m which has thus far contained the pullback. A drop below said level would also constitute a break of the March lows, suggesting that a deeper setback is due.
Momentum continues to turn more bearish for GBP/USD rates. Daily MACD is trending lower and the GBP/USD rates resolving themselves below the daily 5-, 8-, 13-, and 21-EMA envelope, which has remained in bearish sequential order as the evening star candle cluster has formed, suggests that more downside is possible from here.
IG Client Sentiment Index: GBP/USD Rate Forecast (March 30, 2021) (Chart 4)
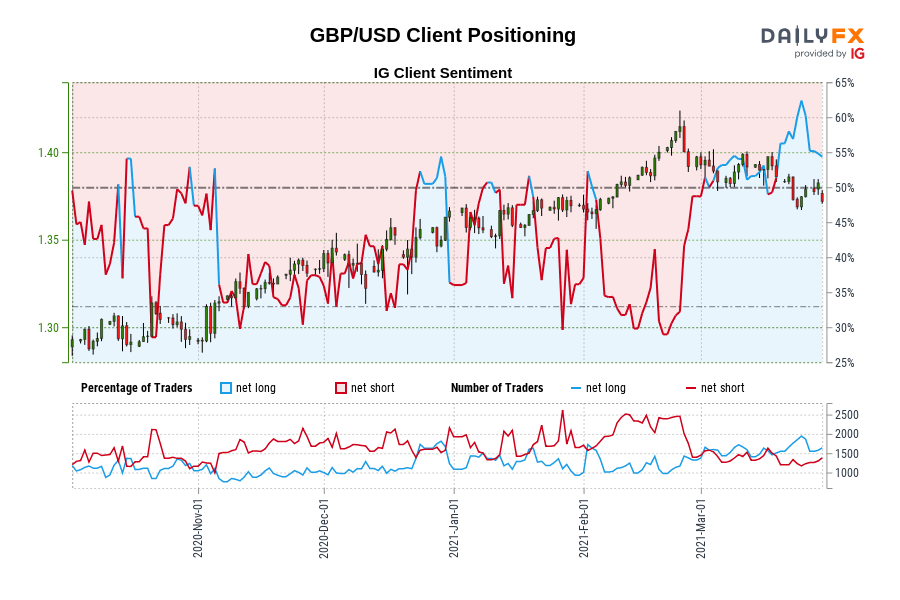
GBP/USD: Retail trader data shows 49.46% of traders are net-long with the ratio of traders short to long at 1.02 to 1. The number of traders net-long is 5.09% higher than yesterday and 14.67% lower from last week, while the number of traders net-short is 14.23% higher than yesterday and 25.65% higher from last week.
We typically take a contrarian view to crowd sentiment, and the fact traders are net-short suggests GBP/USD prices may continue to rise.
Traders are further net-short than yesterday and last week, and the combination of current sentiment and recent changes gives us a stronger GBP/USD-bullish contrarian trading bias.
EUR/GBP RATE TECHNICAL ANALYSIS: DAILY CHART (February 2020 to March 2021) (CHART 5)
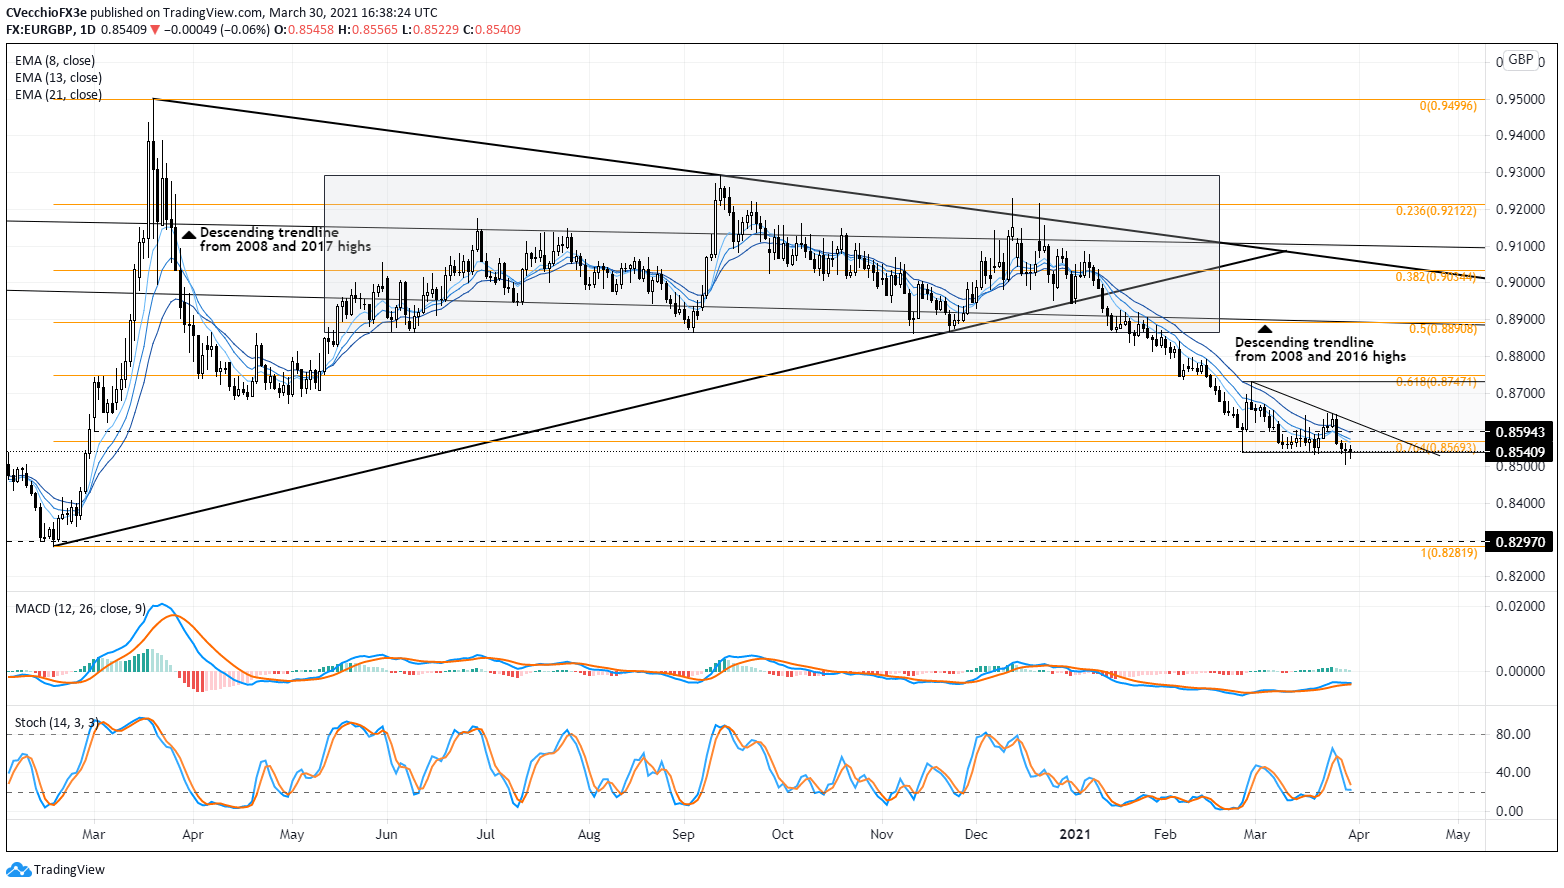
In the lasttwo updates it was noted that “EUR/GBP rates have not recovered despite the indicators working off their stretched bearish readings, suggesting that there is still an inherent downward bias among traders. ” Let’s make it three in a row: the nature of the technical studies suggests relative to price action suggests more downside may soon emerge.
It was also noted that “in context of the symmetrical triangle bearish breakout, any consolidation see in EUR/GBP rates would be seen as a bear flag with support at 0.8539 and resistance at 0.8731.” The range holds for now.
But with EUR/GBP rates below their daily 5-, 8-, 13-, and 21-EMA envelope, which remains in bearish sequential order, daily MACD on the verge of issuing a sell signal in bearish territory, and daily Slow Stochastics nearing a drop into overbought territory, EUR/GBP rates appear to be on the precipice of a bearish breakout.
IG Client Sentiment Index: EUR/GBP Rate Forecast (March 30, 2021) (Chart 6)
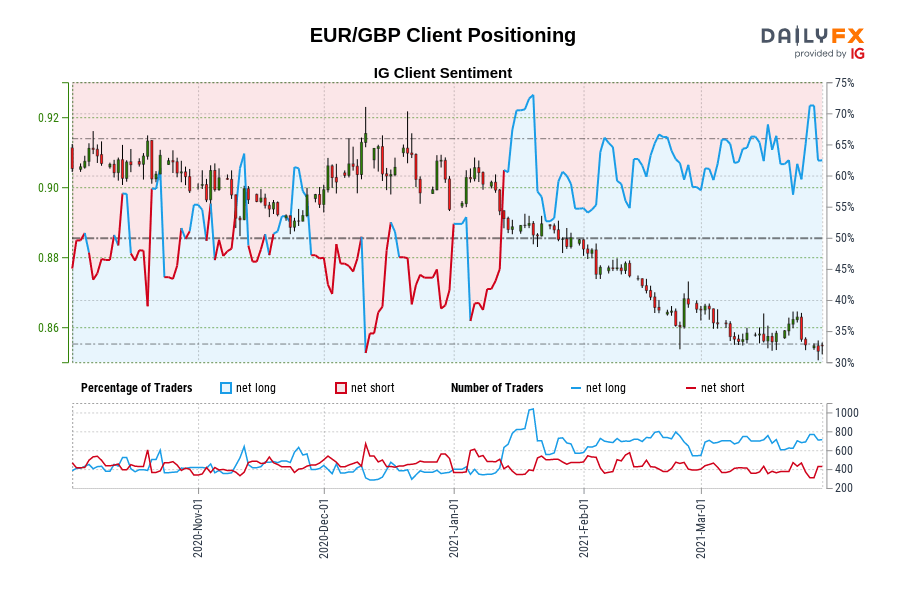
EUR/GBP: Retail trader data shows 60.97% of traders are net-long with the ratio of traders long to short at 1.56 to 1. The number of traders net-long is 1.46% lower than yesterday and 10.42% higher from last week, while the number of traders net-short is 32.68% higher than yesterday and 4.63% higher from last week.
We typically take a contrarian view to crowd sentiment, and the fact traders are net-long suggests EUR/GBP prices may continue to fall.
Positioning is less net-long than yesterday but more net-long from last week. The combination of current sentiment and recent changes gives us a further mixed EUR/GBP trading bias.
--- Written by Christopher Vecchio, CFA, Senior Currency Strategist


