


British Pound, GBP/USD, GBP/JPY, GBP/CHF, EUR/GBP – Talking Points:
- GBP/USD eyeing a retest of the yearly high.
- Ascending Schiff Pitchfork guiding GBP/JPY higher.
- Ascending Triangle break hints at further gains for GBP/CHF.
- Range resistance capping EUR/GBP upside.
The British Pound slipped lower against its major counterparts at the tail-end of February, with the Euro, Japanese Yen, Swiss Franc and US Dollar gaining ground against the currency. However, this recent weakness may prove short-lived. Here are the key levels to watch for GBP/USD, GBP/JPY, GBP/CHF and EUR/GBP.
GBP/USD Daily Chart – Eyeing a Retest of the Yearly High
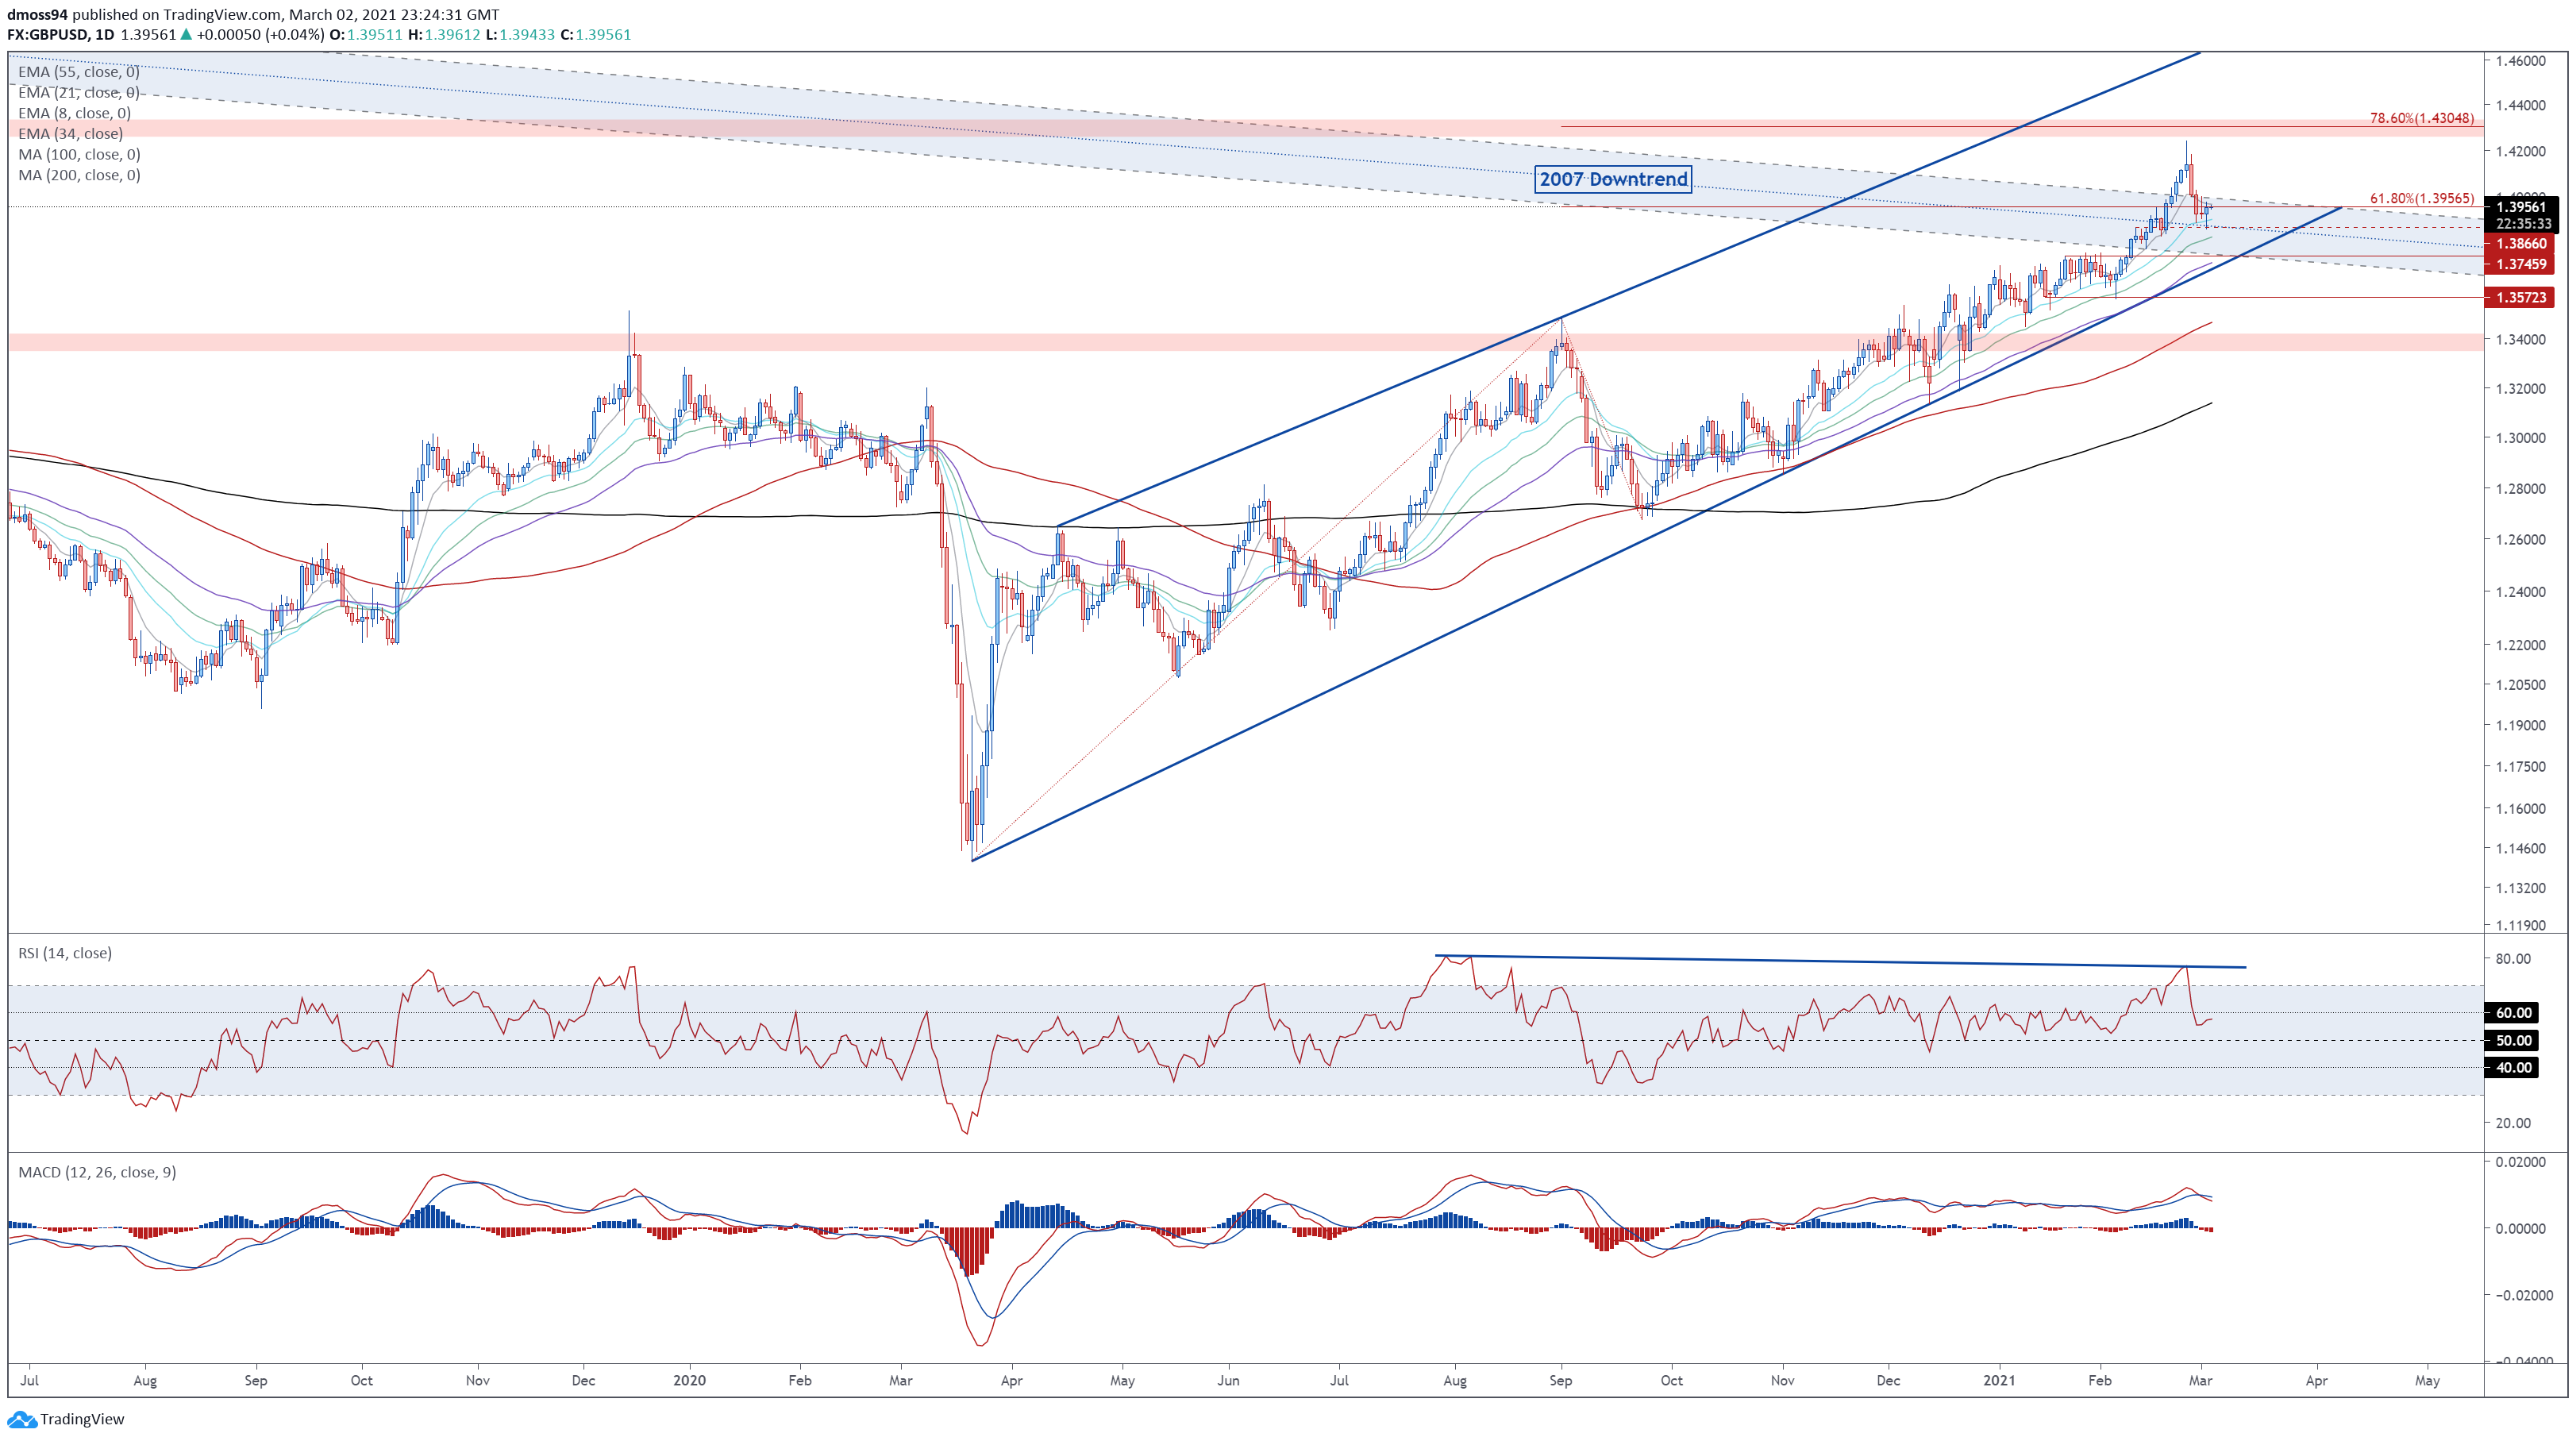
GBP/USD daily chart created using Tradingview
The inability of GBP/USD to gain a firm foothold above psychological resistance at 1.4200 opened the door for sellers to drive the exchange rate back towards former resistance-turned-support at the February 10 high (1.3866).
However, it appears this is nothing more than a short-term pullback, as price remains constructively perched above the 21-EMA and psychologically imposing 1.3900 mark.
With both the RSI and MACD tracking firmly above their respective neutral midpoints, the path of least resistance seems higher.
A daily close back above 1.4000 would probably generate a push to retest the yearly high (1.4241), with a convincing break above bringing the 78.6% Fibonacci (1.3405) into the crosshairs.
Conversely, sliding ack below the 21-EMA (1.3901) could ignite a more extended pullback towards the trend-defining 55-EMA (1.3717).
| Change in | Longs | Shorts | OI |
| Daily | 3% | -7% | -3% |
| Weekly | 4% | -10% | -5% |
GBP/JPY Daily Chart – Schiff Pitchfork Guiding Price Higher
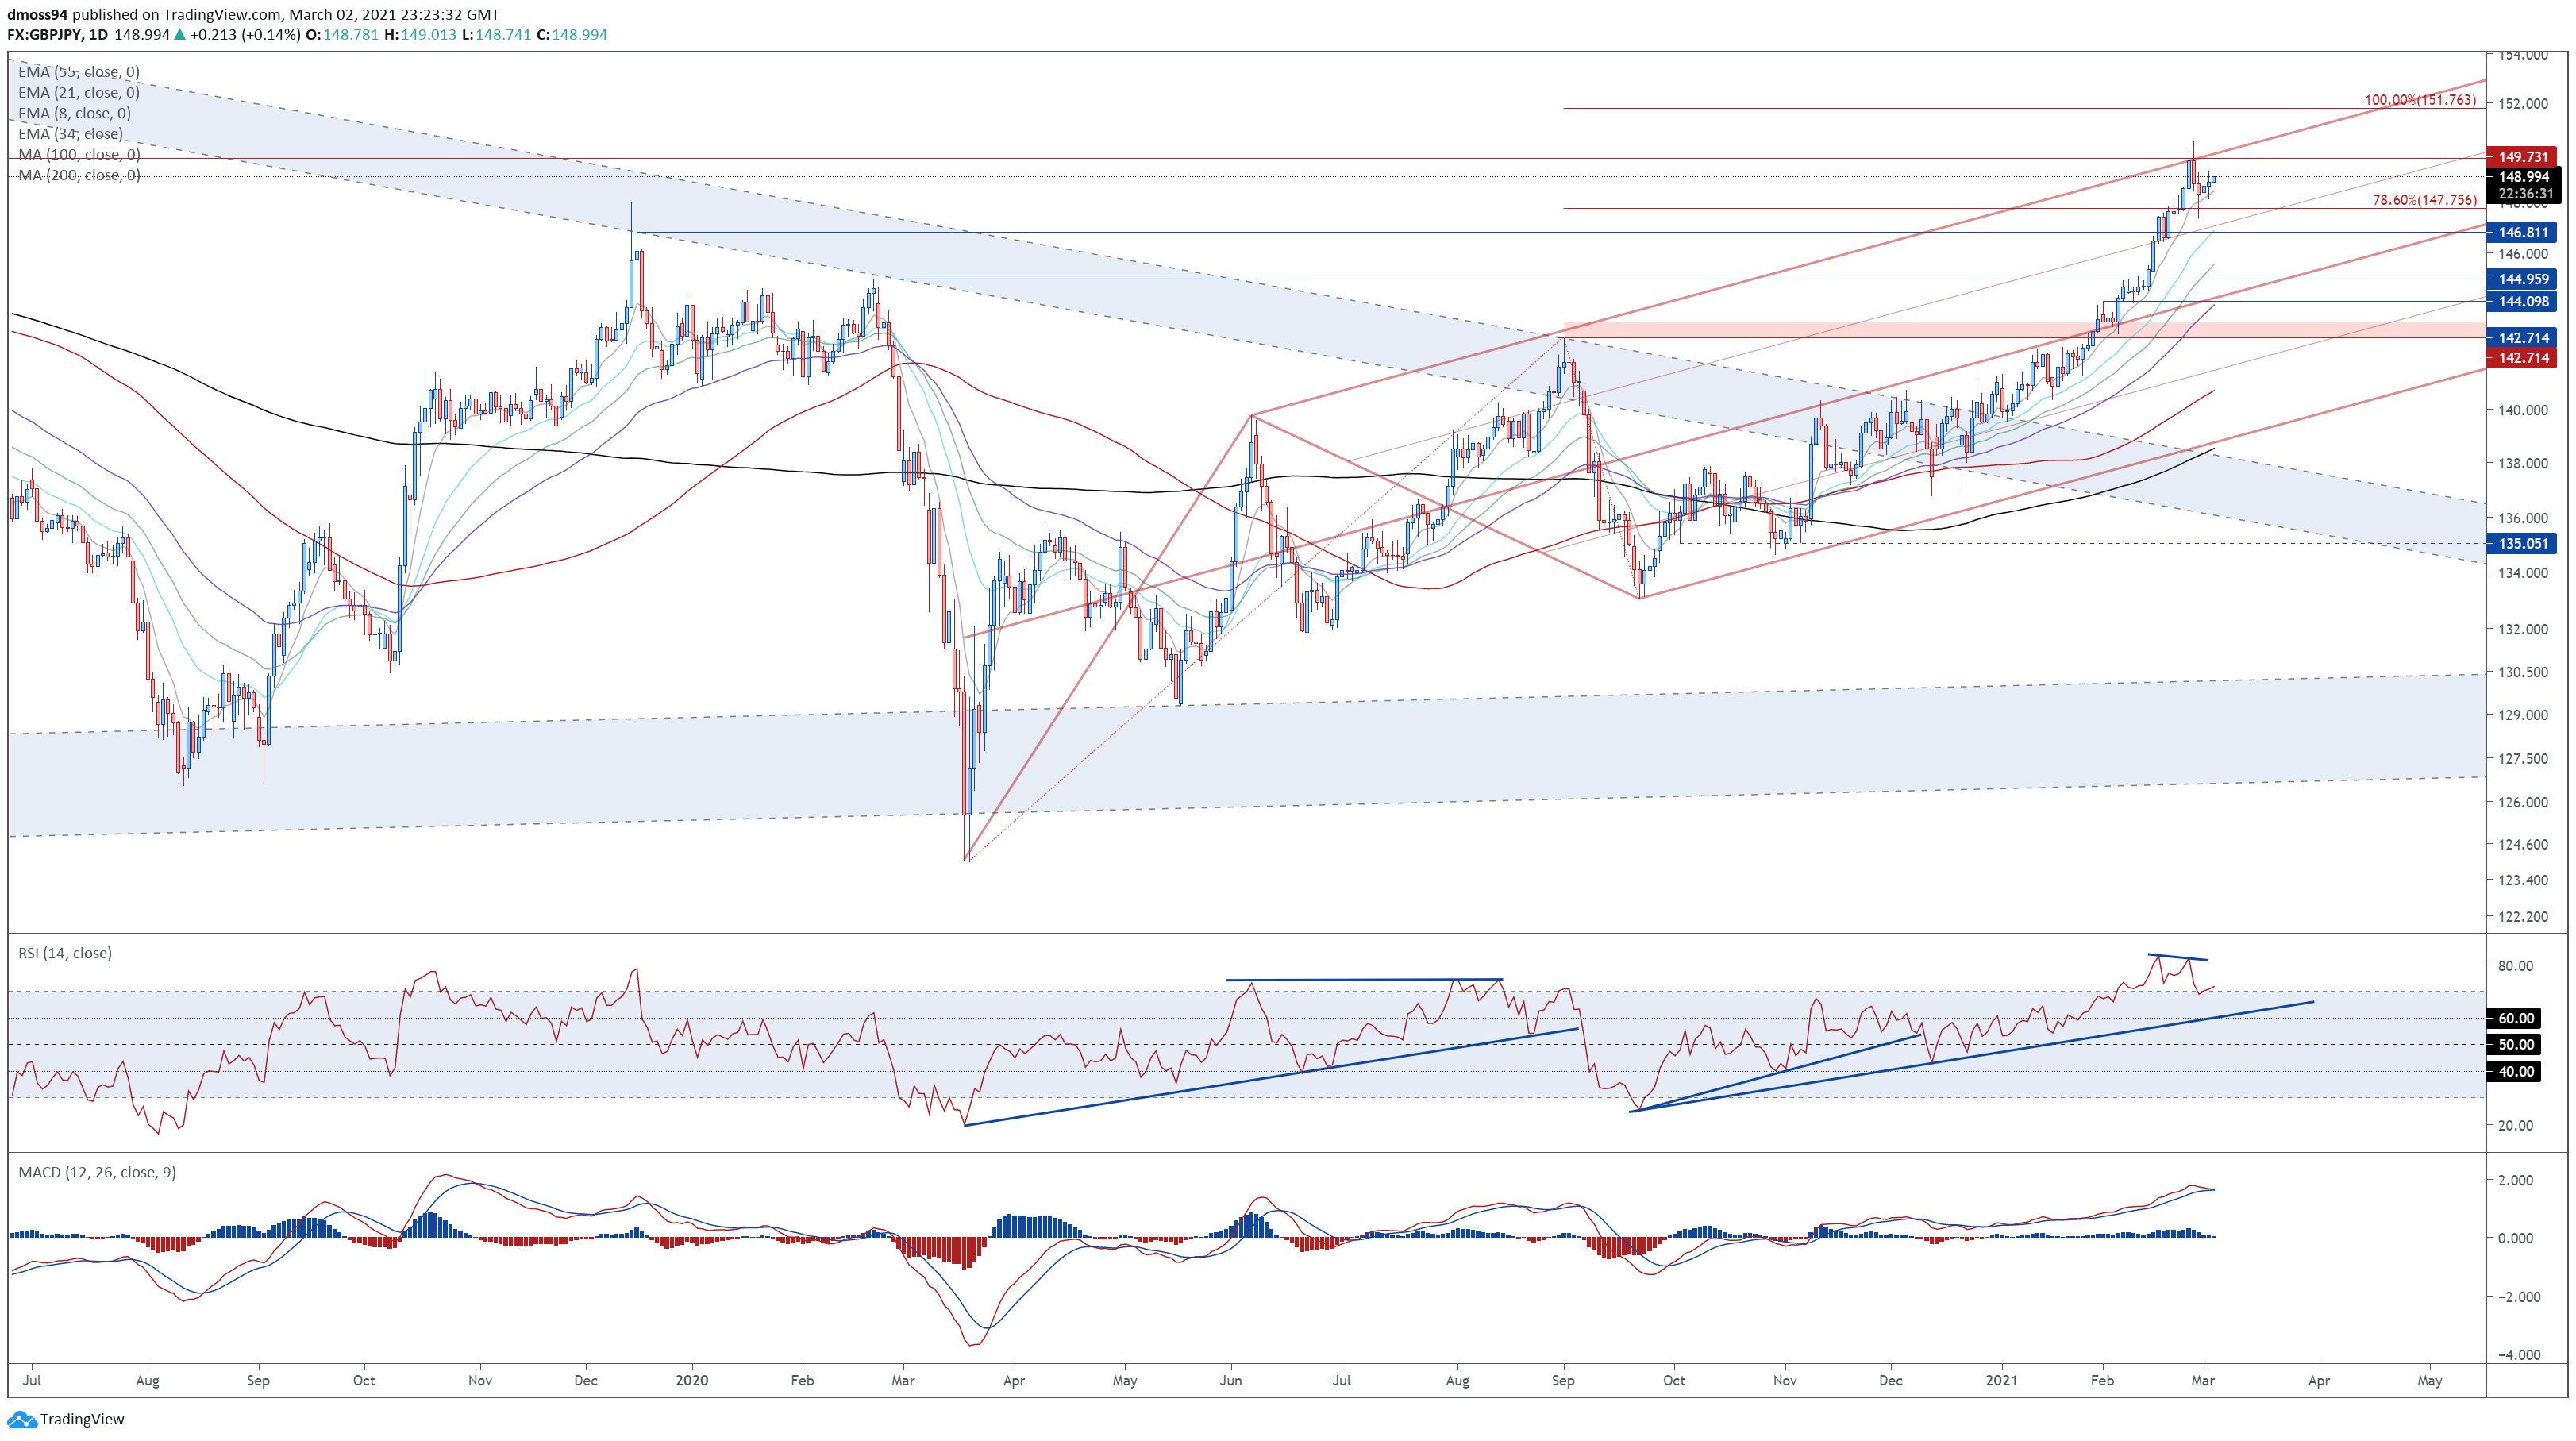
GBP/JPY daily chart created using Tradingview
GBP/JPY rates also slipped lower at the end of February, after failing to remain constructively positioned above psychological resistance at 150.00.
However, with price tracking within the confines of an ascending Schiff Pitchfork, and firmly above all six moving averages, further gains look likely in the near term.
Ultimately a daily close above 149.00 is needed to pave that way for buyers to challenge the yearly high (150.44). Hurdling that would likely signal the resumption of the primary uptrend and bring the 100% Fibonacci (151.76) into focus.
On the other hand, failing to gain a firm foothold above 149.00 could intensify short-term selling pressure and trigger a pullback to confluent support at the pitchfork 50% line and the 78.6% Fibonacci (147.75).
| Change in | Longs | Shorts | OI |
| Daily | 1% | -3% | -1% |
| Weekly | 13% | -31% | -17% |
GBP/CHF Daily Chart – Ascending Triangle Break Hints at Further Gains
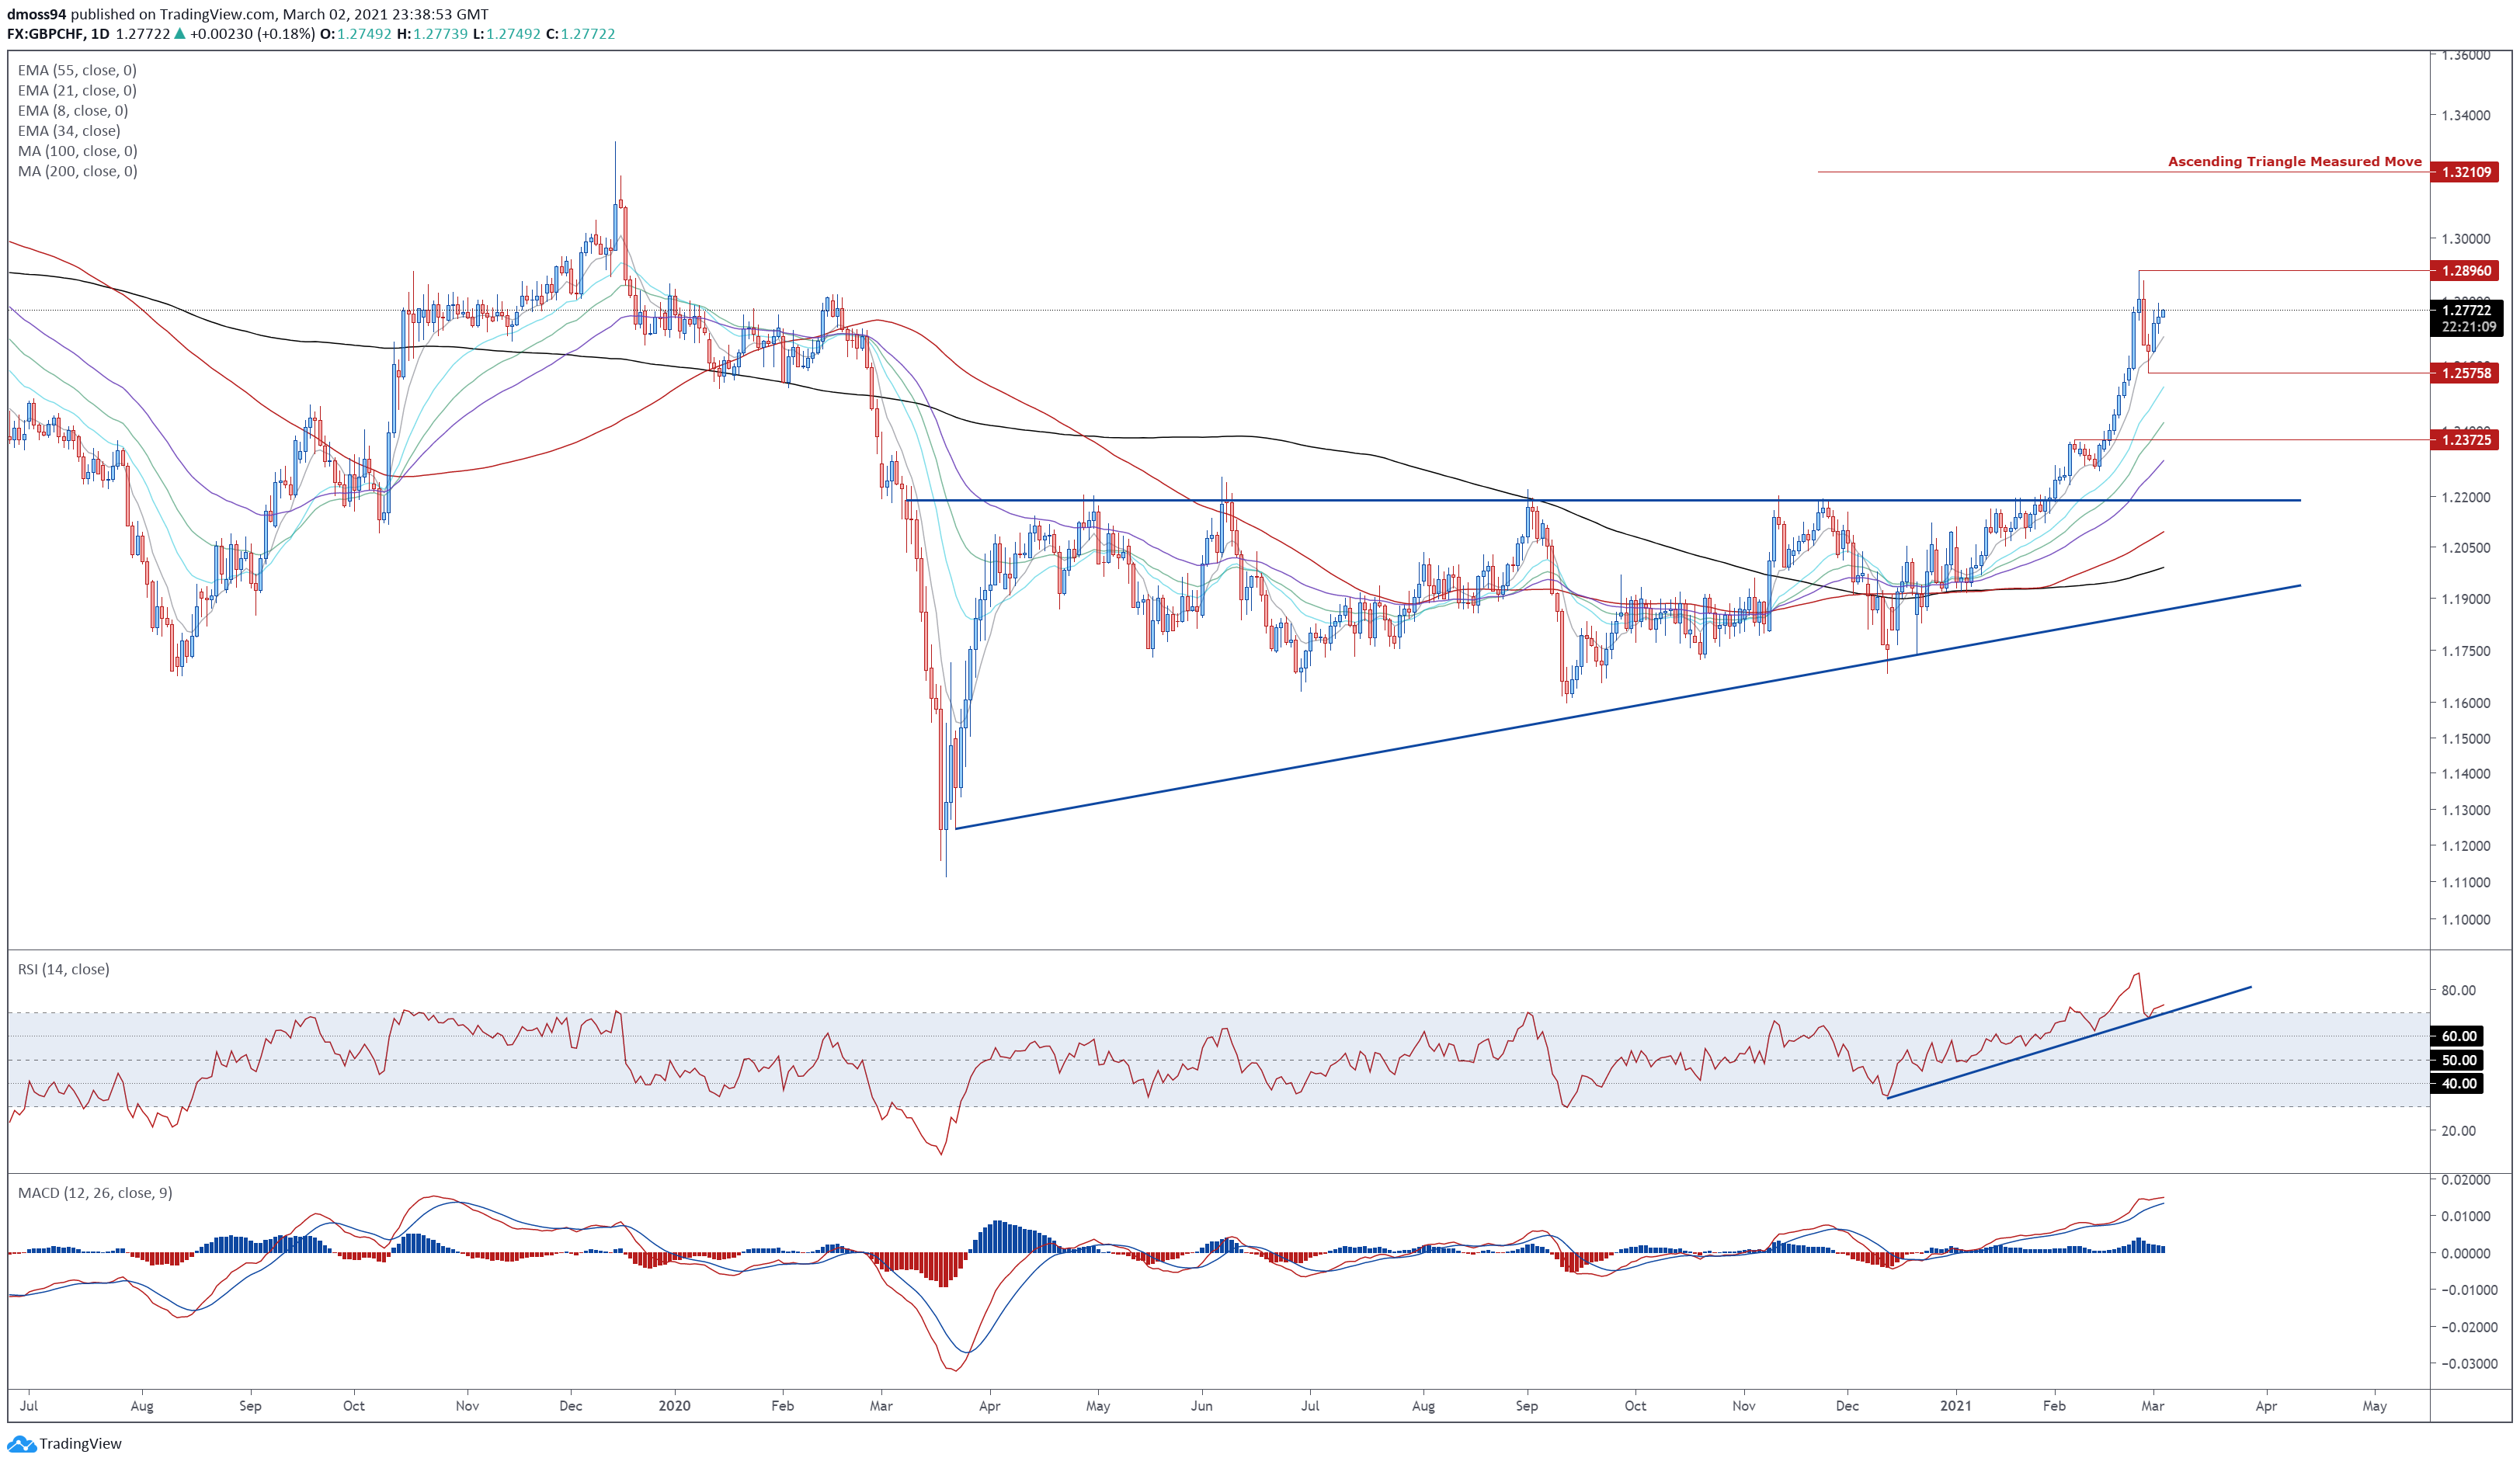
GBP/CHF daily chart created using Tradingview
GBP/CHF rates look poised to continue pressing higher in the coming weeks, as prices surge away from the 8-EMA (1.2688) and 1.2600 mark.
Overbought readings on the RSI, in tandem with the MACD climbing to its highest levels since late-2019, is indicative of swelling bullish momentum.
A convincing break above the February high (1.2896) would likely intensify buying pressure and carve a path for the exchange rate to fulfil the Ascending Triangle’s implied measured move (1.3211).
However, if 1.2800 successfully stifles buyers, a short-term pullback to the monthly low (1.2639) could be in the offing.
EUR/GBP Daily Chart – Range Resistance Capping Upside

EUR/GBP daily chart created using Tradingview
EUR/GBP has recovered lost ground in recent days, after falling to its lowest levels since March of 2020.
However, with the RSI tracking below 40, and the MACD indicator travelling firmly below its neutral midpoint, the path of least resistance remains skewed to the downside.
Failing to climb back above psychological resistance at 0.8700 probably opens the door for the exchange rate to continue sliding lower, with a daily close below the monthly low (0.8620) needed to bring the yearly low (0.8538) into the crosshairs.
On the contrary, a daily close above 0.8700 could ignite a relief rally back towards former support-turned-resistance at the February 5 low (0.8738).
-- Written by Daniel Moss, Analyst for DailyFX
Follow me on Twitter @DanielGMoss


