


British Pound, GBP/USD, GBP/JPY, GBP/NZD, IGCS – Talking Points:
- GBP/USD attempting to push to fresh yearly highs as prices continue to battel with key resistance.
- GBP/JPY poised to extend gains after slicing above Schiff Pitchfork median resistance.
- GBP/NZD may give up gained ground as prices fail to hurdle the trend-defining 50-MA.
The British Pound seems poised to gain ground against its haven-associated counterparts in the near term, after clearing key technical resistance levels. However, the currency may give up gained ground against the cyclically-sensitive New Zealand Dollar. Here are the key levels to watch for GBP/USD, GBP/JPY and GBP/NZD rates.
GBP/USD Daily Chart – Grappling with May 2018 High

GBP/USD daily chart created using Tradingview
GBP/USD rates continue to grapple with key resistance at the May 2018 high (1.3665) after storming away from confluent support at the 2019 high (1.3515) and 21-day exponential moving average.
Bullish moving average stacking, in tandem with both the RSI and MACD indicator tracking firmly above their respective midpoints, suggests that the path of least resistance is higher.
A daily close above 1.3670 is probably required to neutralize near-term selling pressure and carve a path for price to challenge the 78.6% Fibonacci (1.3782). Clearing that brings the psychologically imposing 1.4000 mark into focus.
Alternatively, a pullback towards the 8-day EMA (1.3603) could be on the cards if resistance at the May 2018 high remains intact, with a convincing break below 1.3600 probably opening the door for sellers to drive price back to the 2019 high (1.3515).
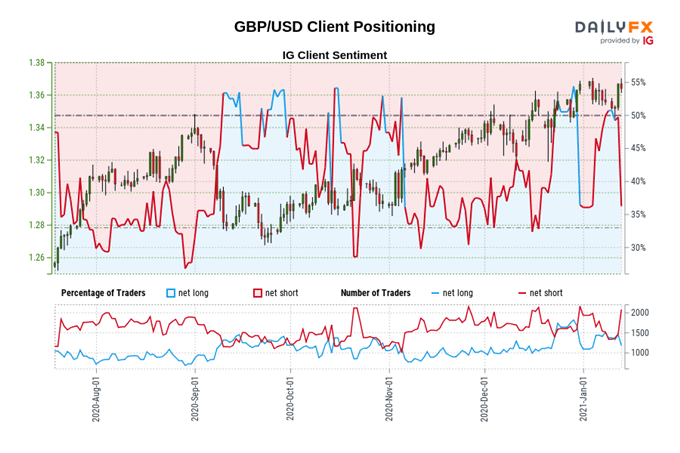
The IG Client Sentiment Report shows 37.14% of traders are net-long with the ratio of traders short to long at 1.69 to 1. The number of traders net-long is 9.10% lower than yesterday and 17.59% lower from last week, while the number of traders net-short is 2.37% higher than yesterday and 31.07% higher from last week.
We typically take a contrarian view to crowd sentiment, and the fact traders are net-short suggests GBP/USD prices may continue to rise.
Traders are further net-short than yesterday and last week, and the combination of current sentiment and recent changes gives us a stronger GBP/USD-bullish contrarian trading bias.
GBP/JPY Daily Chart – Keying in on September 2020 High
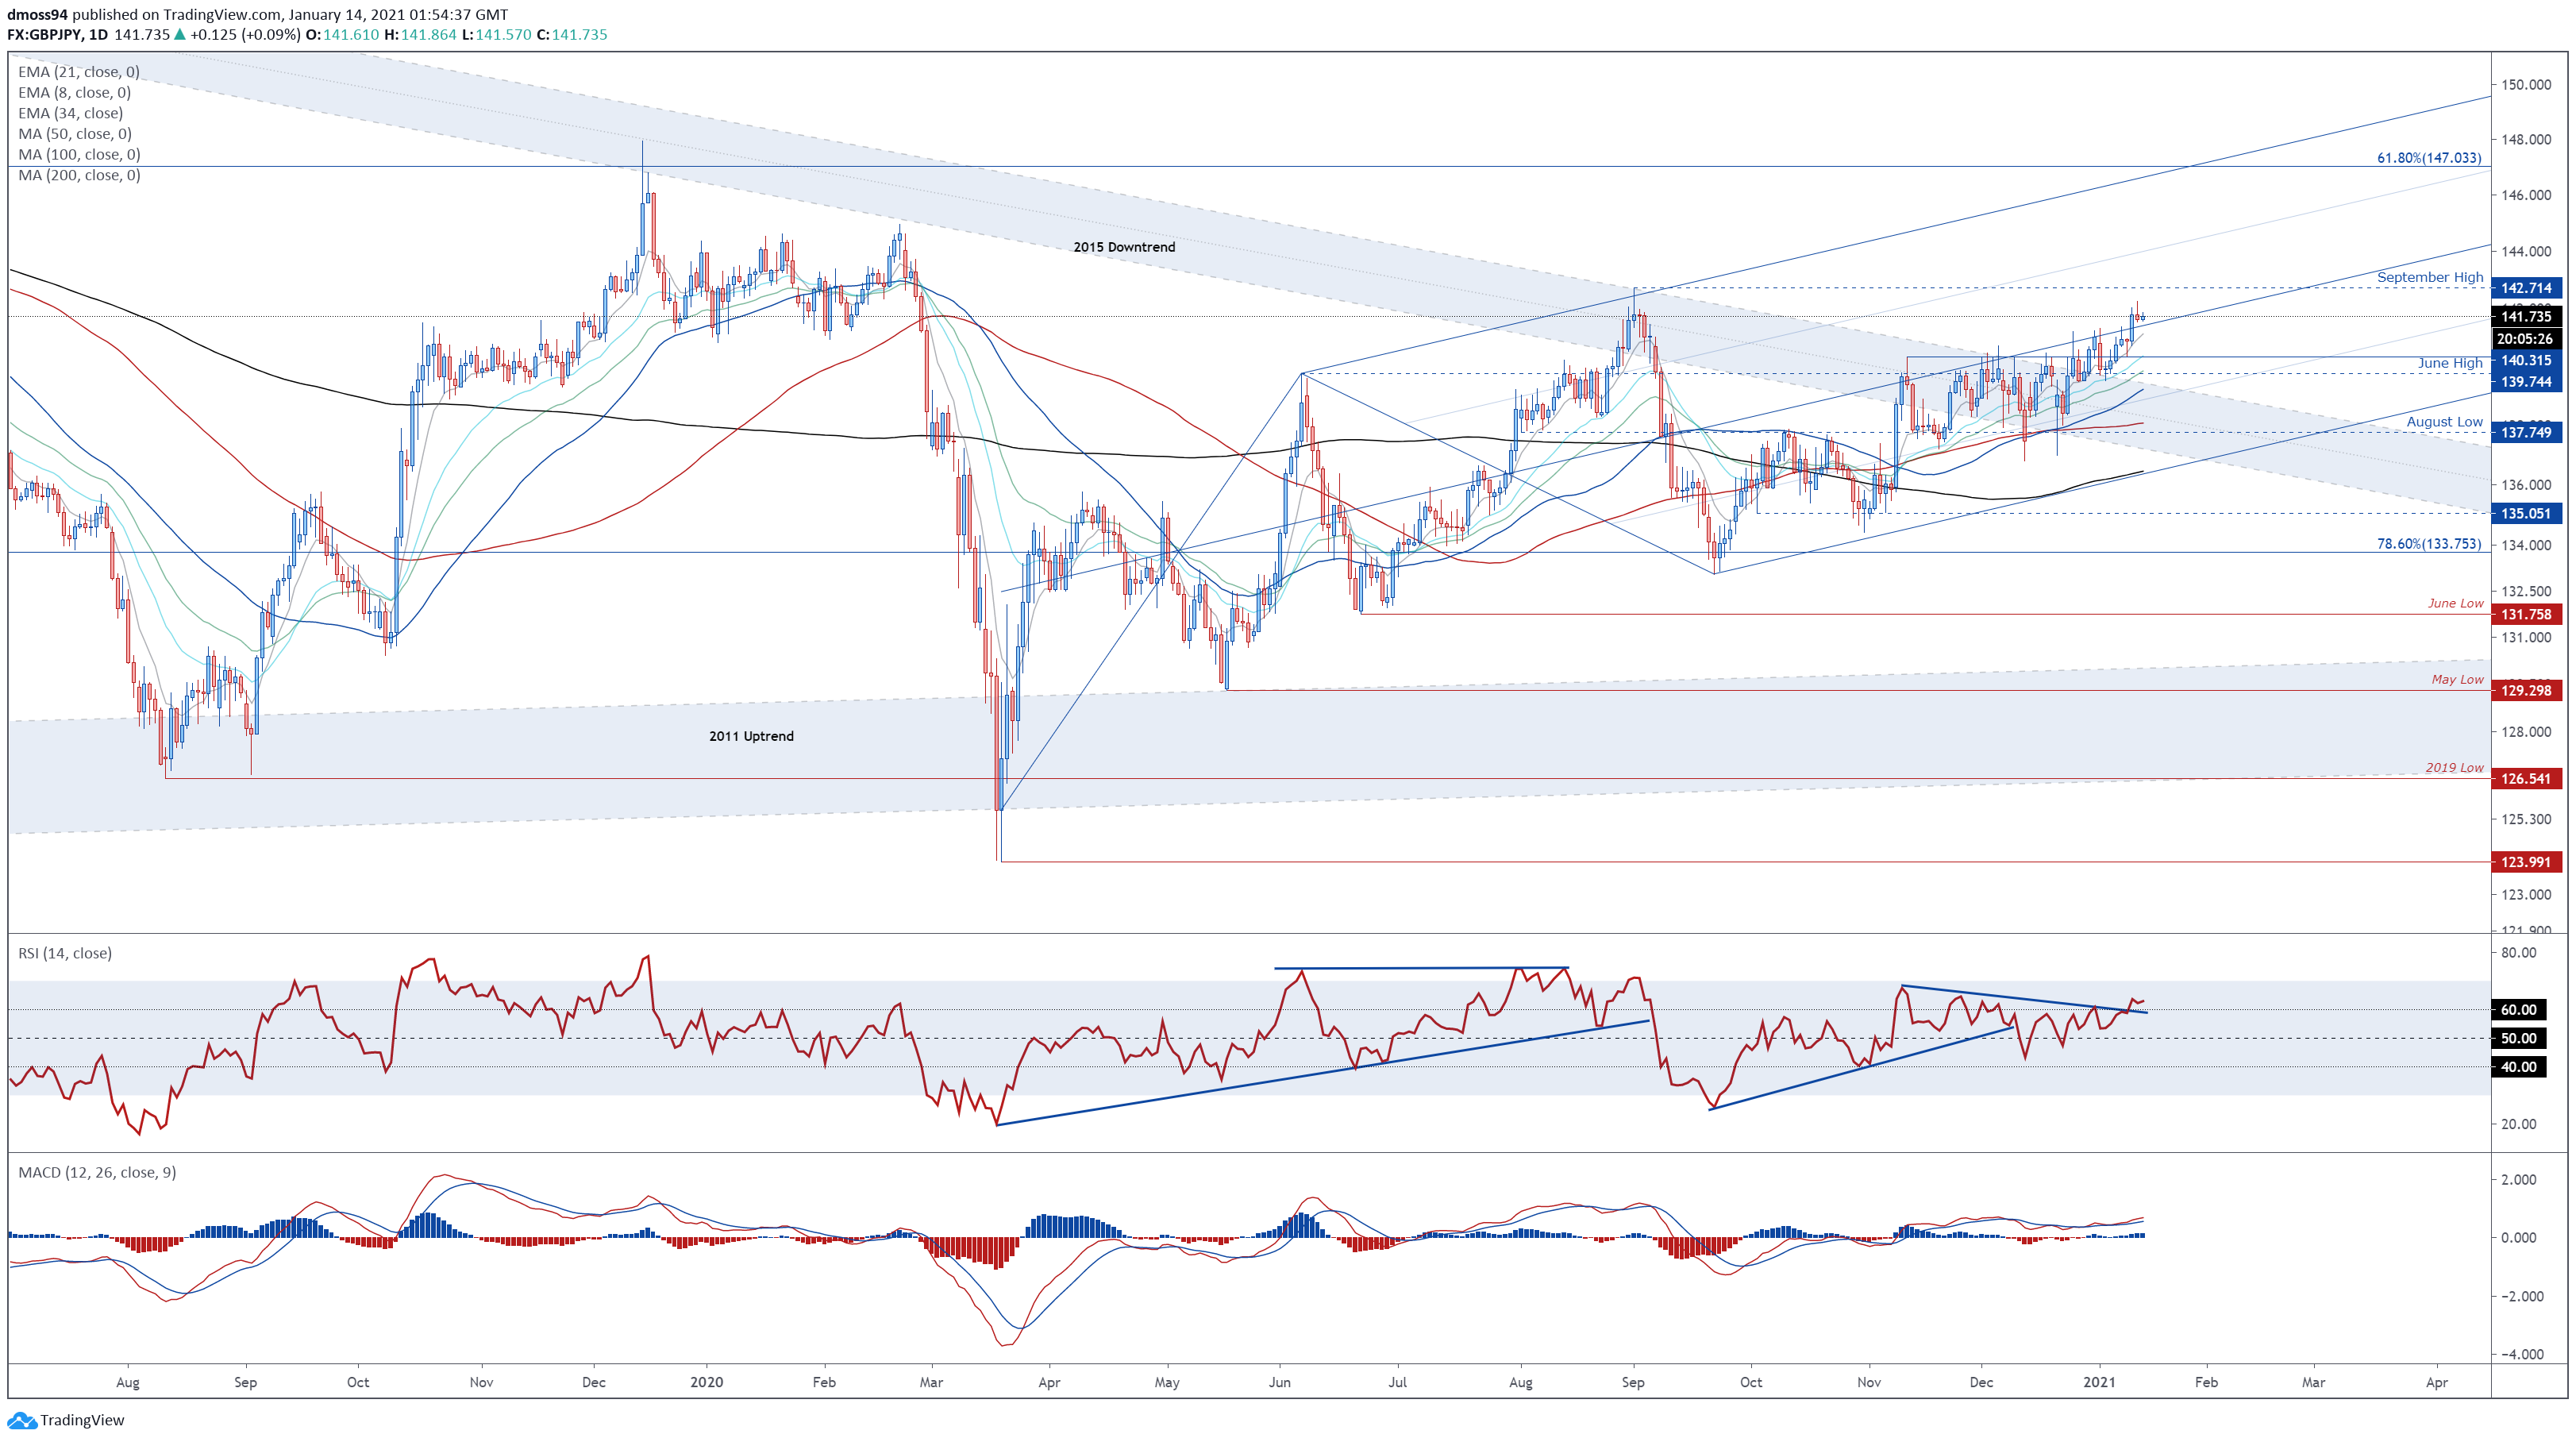
GBP/JPY daily chart created using Tradingview
The GBP/JPY exchange rate appears poised to extend recent gains, as price slices through the Pitchfork median line and January 8 high (141.38).
With the RSI breaching the downtrend extending from the November highs, a more extended topside push could be at hand.
Remaining constructively perched above the Pitchfork median and 141.50 mark likely paves the wave for buyers to propel the exchange rate towards the September high (142.71). A daily close above that needed to bring the 2020 high (144.96) into the crosshairs.
Conversely, a daily close back below 141.50 could trigger a pullback to confluent support at the 21-EMA and November high (140.31).
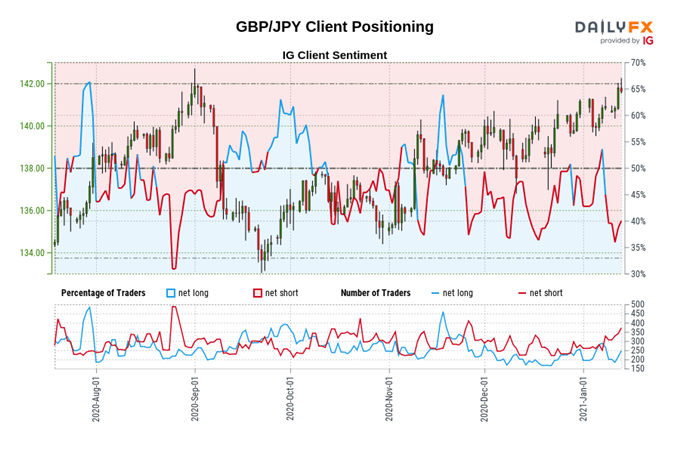
The IG Client Sentiment Report shows 39.46% of traders are net-long with the ratio of traders short to long at 1.53 to 1. The number of traders net-long is 0.40% lower than yesterday and 12.63% lower from last week, while the number of traders net-short is 0.26% lower than yesterday and 47.49% higher from last week.
We typically take a contrarian view to crowd sentiment, and the fact traders are net-short suggests GBP/JPY prices may continue to rise.
Traders are further net-short than yesterday and last week, and the combination of current sentiment and recent changes gives us a stronger GBP/JPY-bullish contrarian trading bias.
GBP/NZD Daily Chart – Schiff Pitchfork Guiding Price Lower

GBP/NZD daily chart created using Tradingview
GBP/NZD seems poised to continue clawing back lost ground, as buyers push the exchange rate back above the Schiff Pitchfork median and 34-EMA (1.8954).
A bullish crossover on the MACD indicator, and the RSI pushing back above 50 for the first time since October, is indicative of swelling bullish momentum.
However, with price still tracking below the sentiment-defining 200-MA (1.9543) and within the confines of a descending Schiff Pitchfork, the longer-term outlook remains skewed to the downside.
Nevertheless, gaining a firm foothold above the 78.6% Fibonacci (1.9024) would probably open the door for prices to probe the 100-MA and former support-turned-resistance at the October 2020 low (1.9324).
On the other hand, failing to breach the 78.6% Fibonacci could trigger a reversal back towards the November 2020 low (1.8897). Clearing that is required to pave the way for sellers to drive the exchange rate back towards the monthly low (1.8627).
-- Written by Daniel Moss, Analyst for DailyFX
Follow me on Twitter @DanielGMoss


