


GBP/USD Highlights:
- GBP/USD stuck around long-term resistance, but..
- It is held up by short-term support levels
GBP/USD has been meandering sideways for pretty much the entire month, with only one serious attempt to break above long-term resistance. In-line with the choppy trading we have seen, the promising breakout attempt on August 18 was thwarted the very next day.
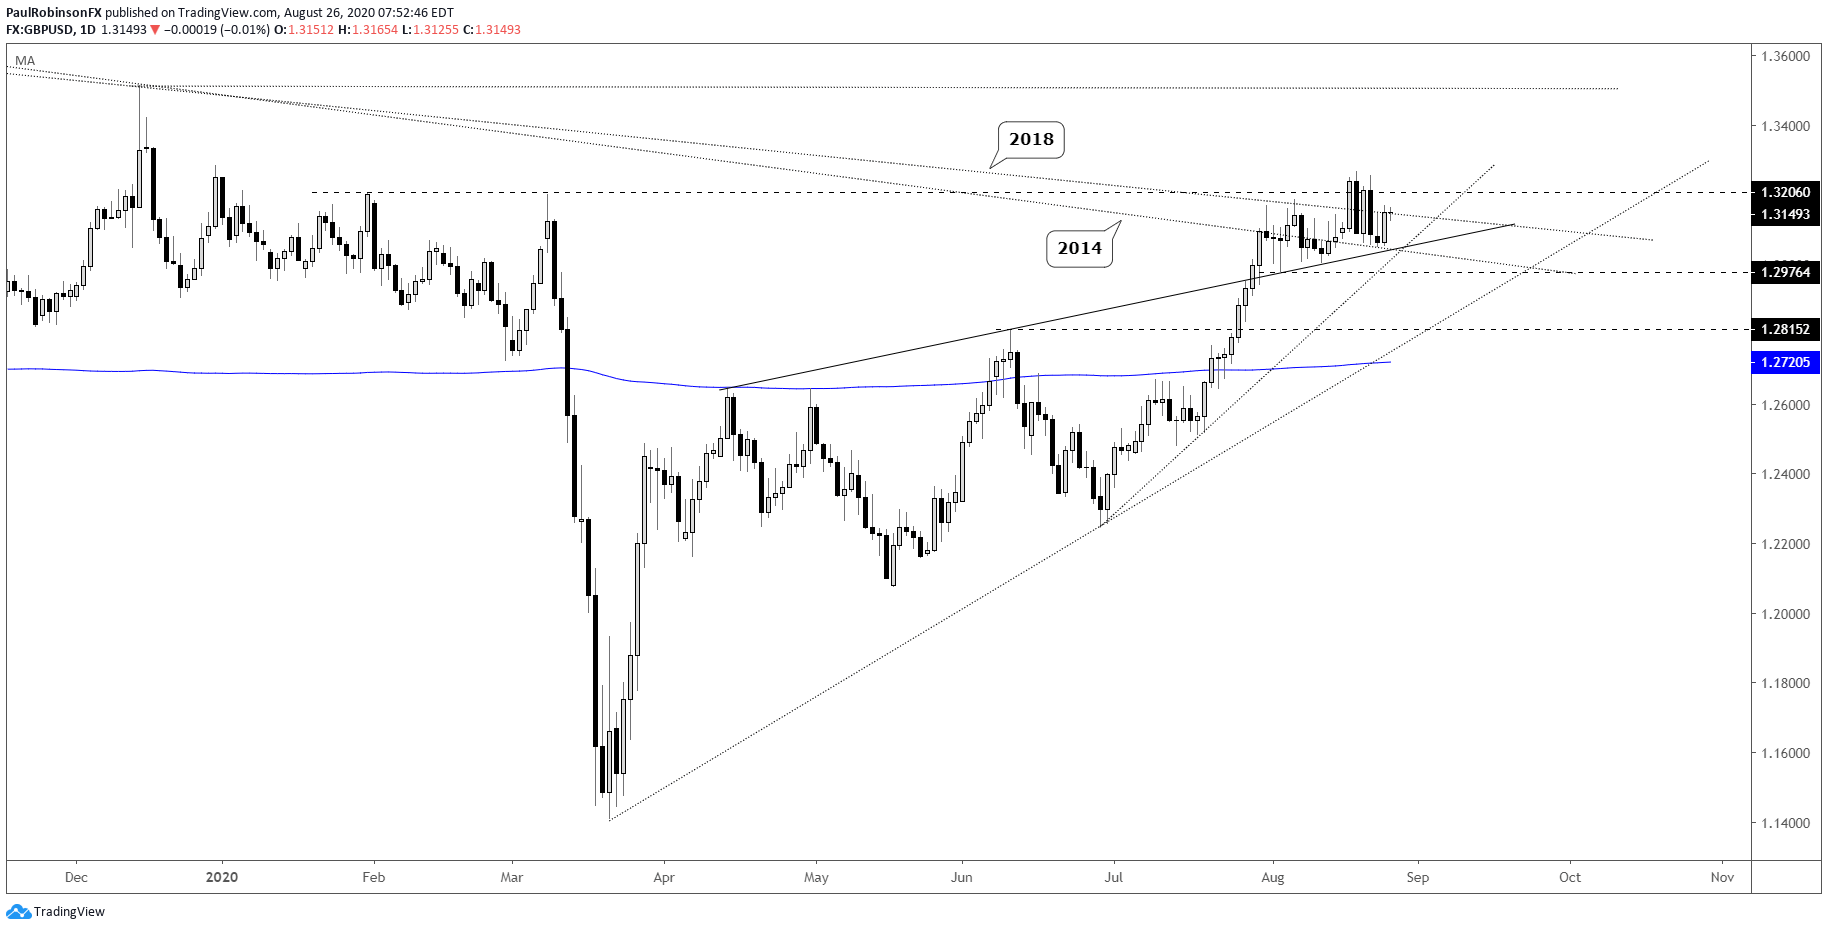
The trend-lines from 2014 and 2018 along with pre-coronavirus plunge levels are keeping cable from advancing. Last week’s reversal week was anticipated to perhaps bring some weakness in this week, but so far so good thanks to short-term support.
There is a slope running up from April over the June high that is helping keep the downside in check. This line has been tagged three times this month, with the most recent test coming on Monday. This line of support may soon get some help from the late-June trend-line. Confluence may play an important factor on another dip to ~13065.
As long as support continues to hold, then further consolidation may set GBP/USD up to break free from resistance. In the event it can, then look for the December high over 13500 to get challenged. Should support fail, the trend-line from March under 12900 could quickly come into play.

GBP/USD Daily Chart (in the thick of resistance)
GBP/USD 4-hr Chart (short-term support)

Resources for Forex & CFD Traders
Whether you are a new or experienced trader, we have several resources available to help you; indicator for tracking trader sentiment, quarterly trading forecasts, analytical and educational webinars held daily, trading guides to help you improve trading performance, and one specifically for those who are new to forex.
---Written by Paul Robinson, Market Analyst
You can follow Paul on Twitter at @PaulRobinsonFX


