


Sterling Technical Price Outlook: GBP/USD Trade Levels
- Sterling technical trade level update – Daily & Intraday Charts
- GBP/USD recovery testing downtrend resistance
- British Pound long-side vulnerable into 1.27
The British Pound has rallied more than 10% against the US Dollar off the March lows with the rally taking Cable towards longer-term downtrend resistance. While the medium-term outlook remains constructive, the immediate advance may be vulnerable here as price approaches key technical resistance. These are the updated targets and invalidation levels that matter on the GBP/USD price charts. Review my latest Weekly Strategy Webinar for an in-depth breakdown of this Cable trade setup and more.
New to Forex Trading? Get started with this Free Beginners Guide
Sterling Price Chart – GBP/USD Daily
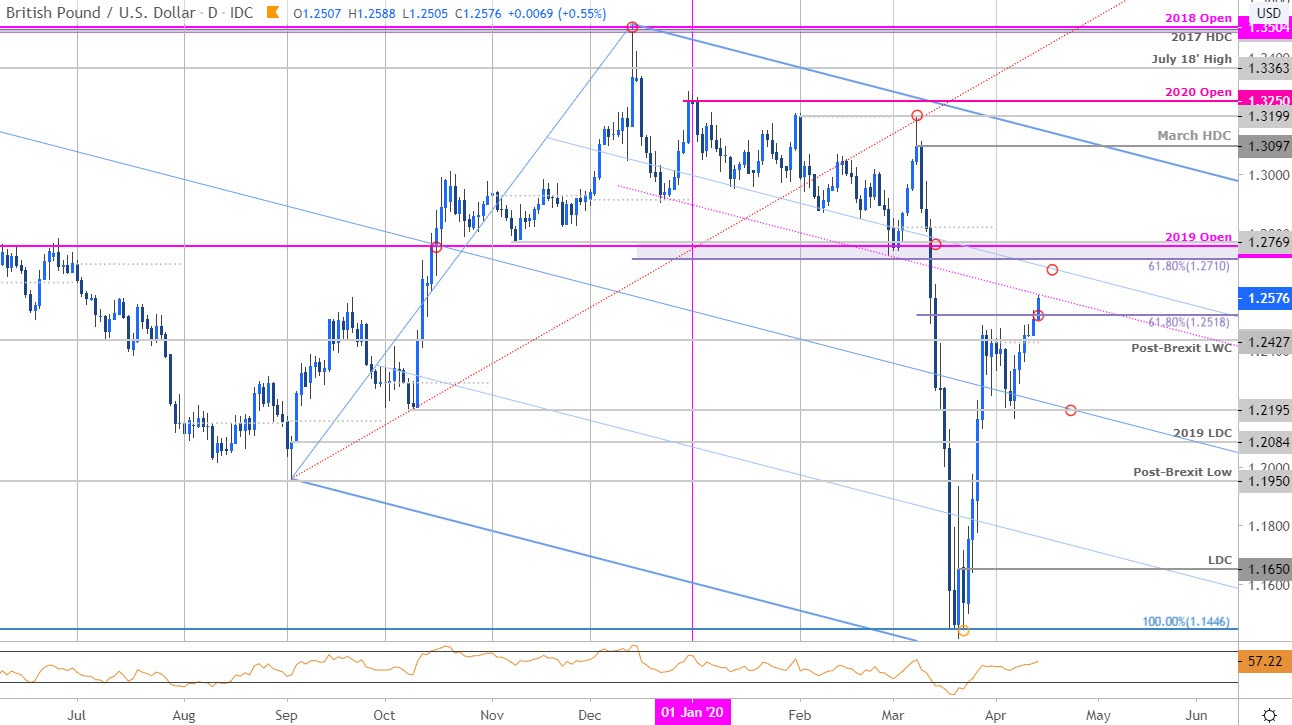
Chart Prepared by Michael Boutros, Technical Strategist; GBP/USD on Tradingview
Technical Outlook: In my latest Sterling Price Outlook we noted that British Pound reversal was testing initial resistance hurdles into the close of the week with a topside breach exposing, “subsequent resistance objectives at the 2018 low-week close at 1.2582 and a key technical confluence at 1.2717/54- a region defined by the 61.8% retracement and the 2019 yearly open.”
Cable broke above the 61.8% retracement of the March range at 1.2518 with the rally taking out targets into 1.2582. The focus now is on a close with respect to the sliding parallel (magenta)- a close below would risk a near-term pullback in price. Broader bullish invalidation now raised to 1.2195 with a breach higher from here eyeing the 75% parallel (currently ~1.2670s) backed by critical resistance steady at 1.2717/54.
Sterling Price Chart – GBP/USD 120min
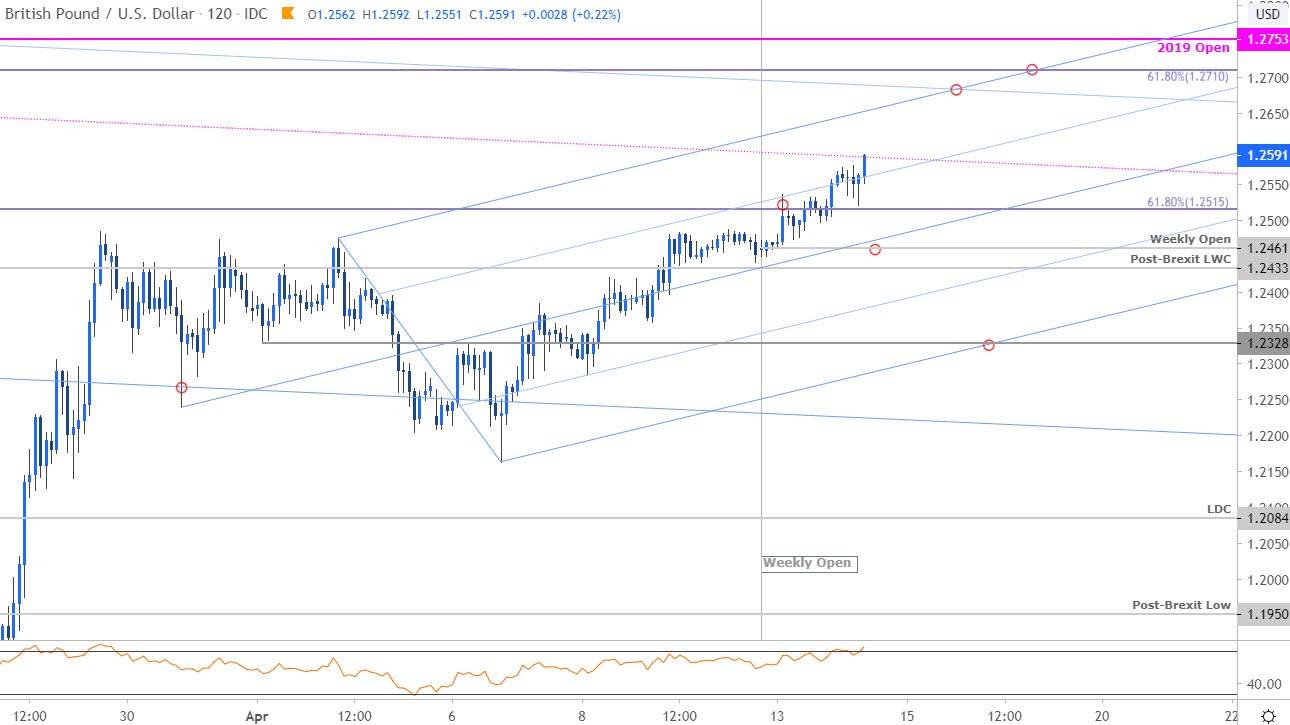
Notes: A closer look at Sterling price action shows GBP/USD trading within the confines of the ascending pitchfork formation with cable attempting to breach the 75% parallel today in New York. Topside resistance objectives are eyed at the highlighted slope confluence near ~1.2670s backed by 1.2710 and 1.2753- look for a more significant reaction there IF reached. Initial support rests at 1.2515 backed by the weekly open at 1.2461 and the post-Brexit low-week close at 1.2433- weakness beyond this zone would risk a larger correction with near-term bullish invalidation now set to 1.2328.

Bottom line: The Sterling breakout is approaching downtrend resistance targets and leaves the immediate advance at risk heading into 1.2710/53. From a trading standpoint, look to reduce long-exposure / raise protective stops on a stretch towards the upper parallel- look for possible topside exhaustion there IF reached. Ultimately a larger pullback may offer more favorable entries closer to uptrend support. Review my latest British Pound Weekly Price Outlook for a closer look at the longer-term GBP/USD technical trade levels.
For a complete breakdown of Michael’s trading strategy, review his Foundations of Technical Analysis series on Building a Trading Strategy
Sterling Trader Sentiment – GBP/USD Price Chart
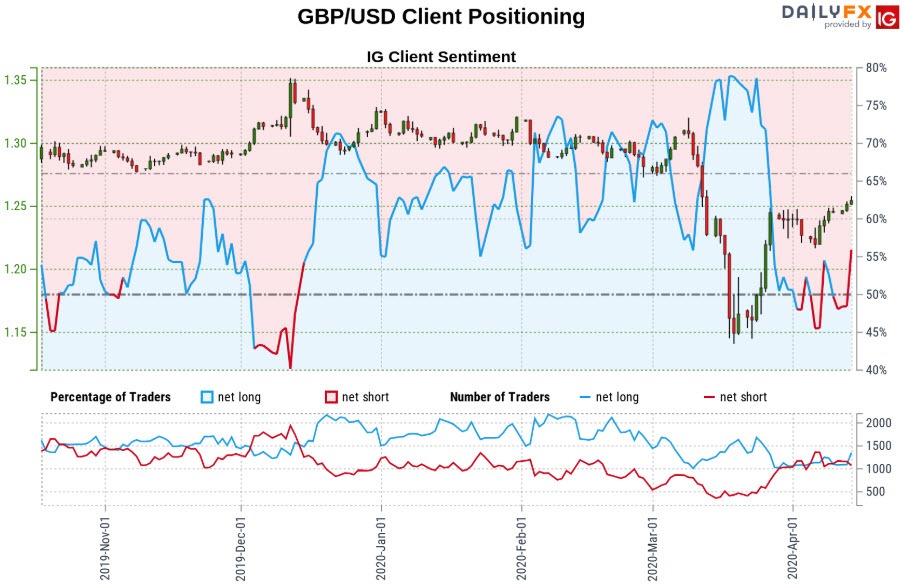
- A summary of IG Client Sentiment shows traders are net-long GBP/USD - the ratio stands at +1.38 (58% of traders are long) – bearish reading
- Long positions are2.36% higher than yesterday and 16.09% higher from last week
- Short positions are1.81% higher than yesterday and 4.91% lower from last week
- We typically take a contrarian view to crowd sentiment, and the fact traders are net-long suggests GBP/USD prices may continue to fall. Traders are further net-long than yesterday and last week, and the combination of current positioning and recent changes gives us a stronger GBP/USD-bearish contrarian trading bias from a sentiment standpoint.
| Change in | Longs | Shorts | OI |
| Daily | 15% | -13% | 1% |
| Weekly | 9% | -3% | 3% |
---
Key UK / US Data Releases
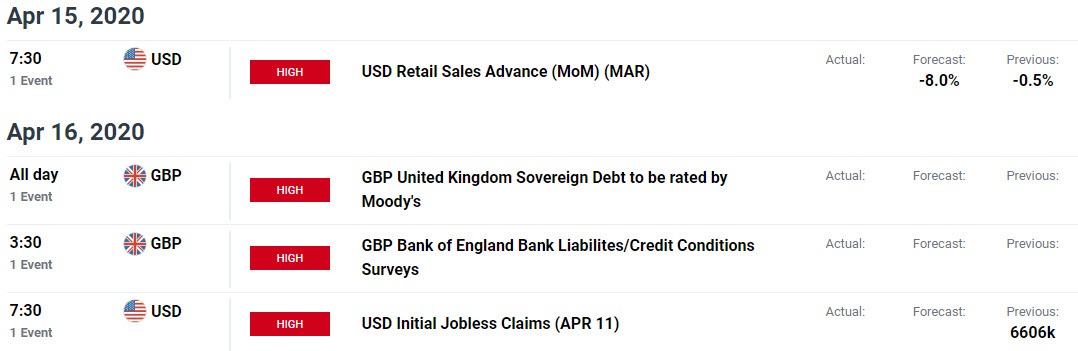
Economic Calendar - latest economic developments and upcoming event risk.
Active Trade Setups
- Gold Price Outlook: XAU/USD Breakout Stalls into March Close
- Euro Price Outlook: EUR/USD Rips as Markets Surges on Virus Stimulus
- S&P 500 Price Outlook: Bear Market Rally Looks to Build on Stimulus
- Canadian Dollar Price Outlook: USD/CAD Virus Breakout may be Overdone
- Written by Michael Boutros, Currency Strategist with DailyFX
Follow Michael on Twitter @MBForex


