


GBP/USD Outlook
- British Pound price action against US Dollar.
- GBP/USD chart and technical analysis
Download for free our latest Q4 trading guides to help you build confidence when you trade on JPY, USD and other main currencies
GBP/USD Price – Uptrend Move Recovery
On October 18, uptrend momentum led GBP/USD to its highest level in nearly five and half months. Later, buyers paused this move, and this kept the price in a sideways pattern for six weeks. Today, Cable resumed bullish price action and broke above 1.3012 printing its highest level in nearly seven months at 1.3063.
This week, the Relative Strength Index (RSI) pointed higher from 57 to 67, highlighting a clear recovery of current uptrend momentum.
Just getting started? See our Beginners’ Guide for FX traders
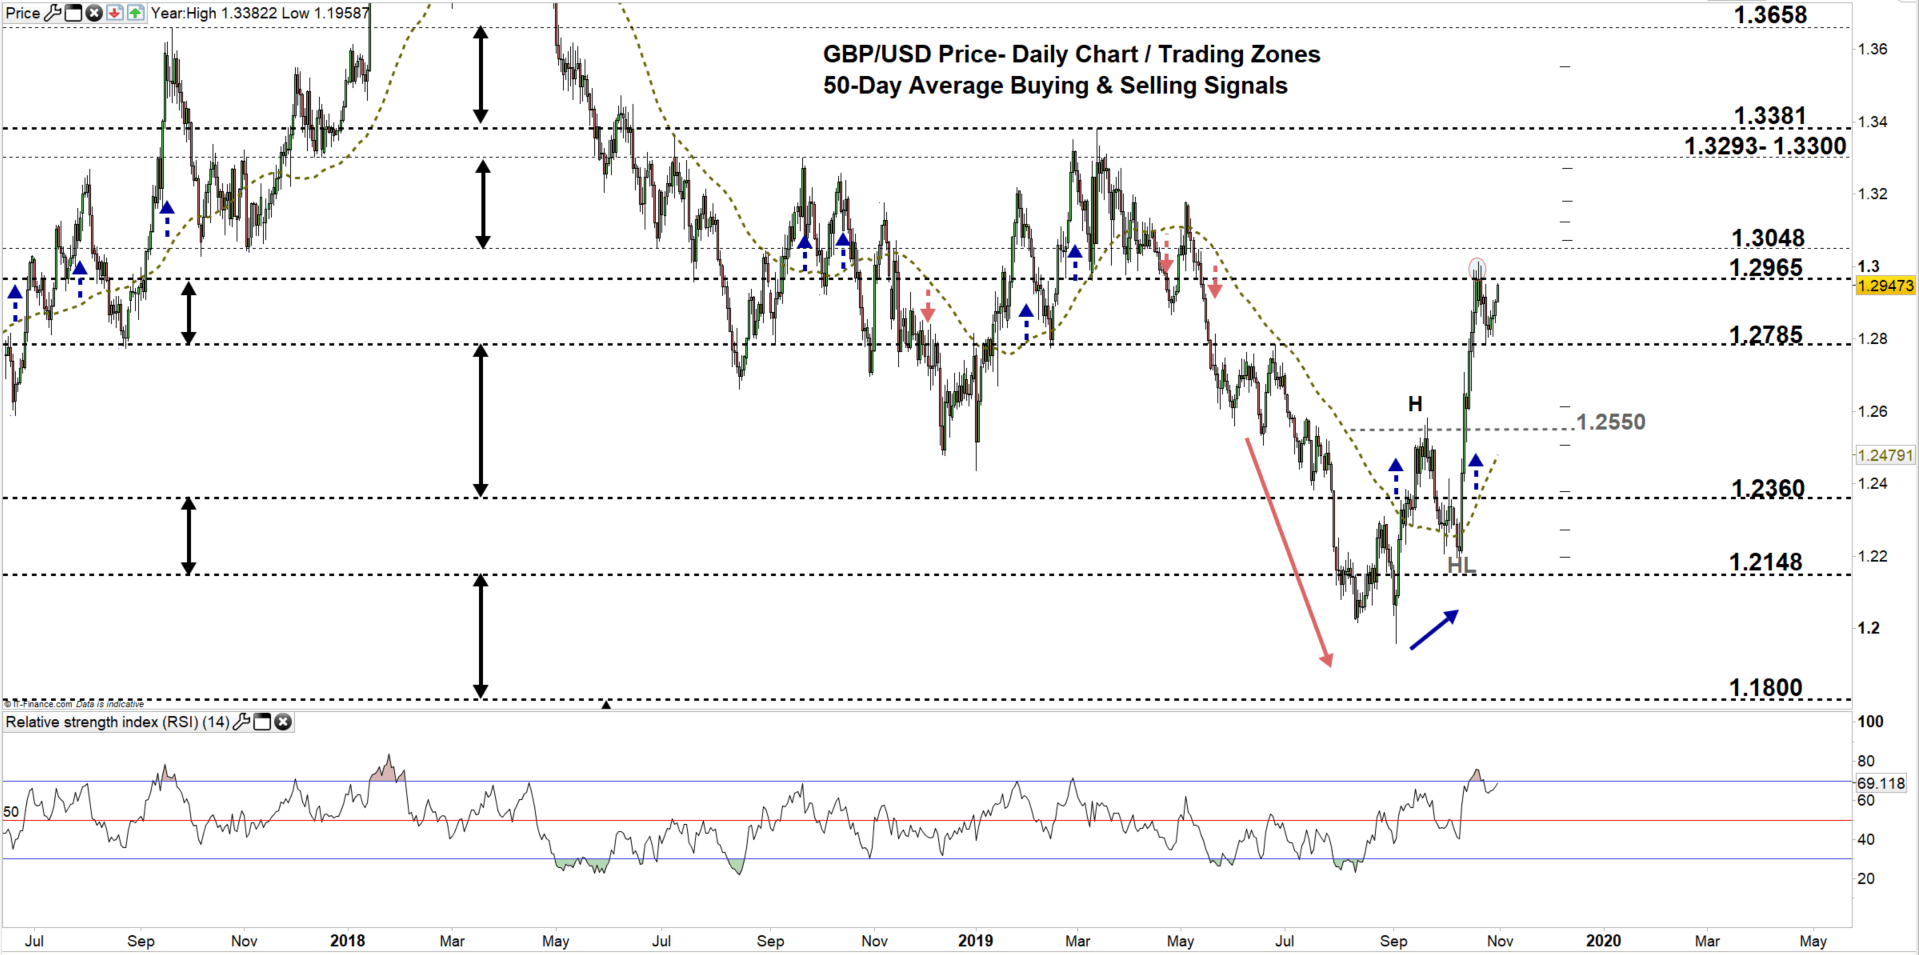
GBP/USD DAILY PRICE CHART (DEC 1, 2017 – DEC 4, 2019) Zoomed out
GBP/USD DAILY PRICE CHART (Jan 4 – DEC 4, 2019) Zoomed IN
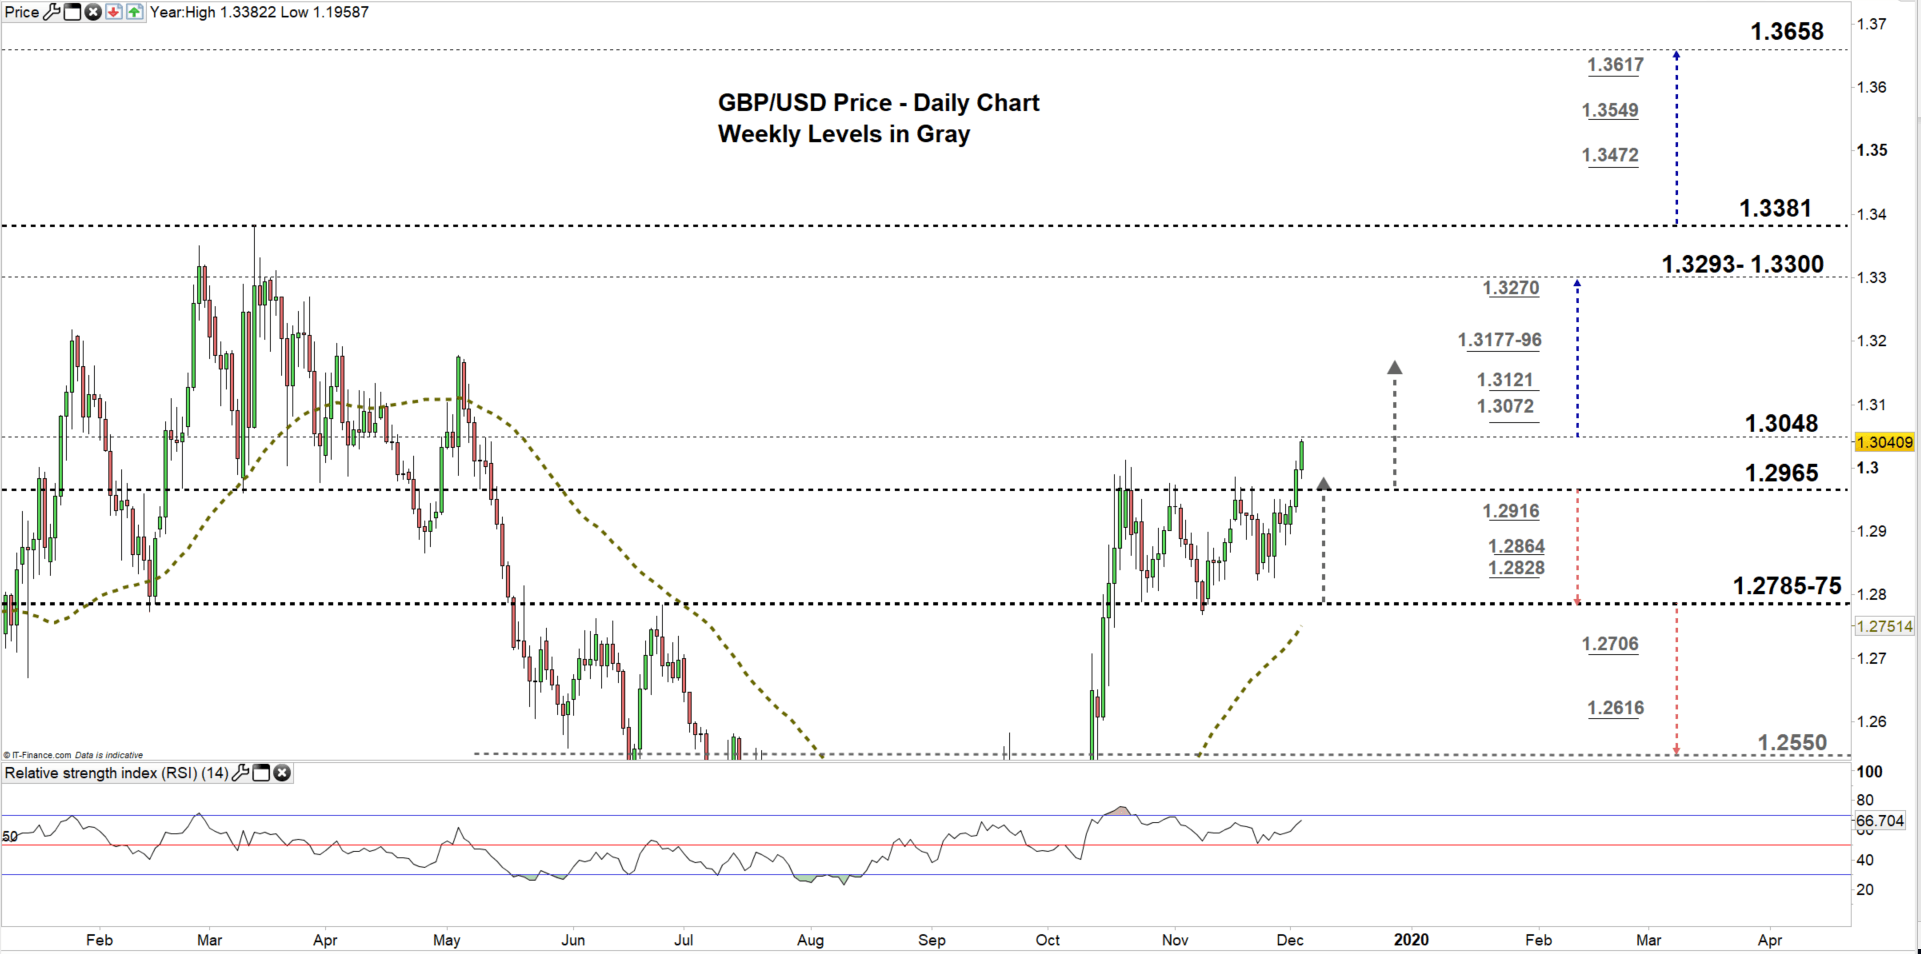
From the daily chart, we notice yesterday, GBP/USD rallied to a higher trading zone 1.2965 – 1.3048. Today, the price has tested the high end of the zone.
Hence, a close above the high end could embolden more market’s participants to push Cable towards the vicinity of 1.3293-1.3300. Nevertheless, this rally may weaken at the weekly resistance levels and area marked on the chart (zoomed in) as they offer an attractive exit points for some buyers. Others may take profit nearby 1.3150 as discussed in our previous updates.
That said, a close below the low end of current zone would mean buyer’s pullback. This could reverse the price’s direction sending GBPUSD towards the vicinity of 1.2785-75. Further close below 1.2775 might pave the way for sellers to press towards 1.2550. In that scenario, the weekly support levels underscored on the chart should be considered.
Having trouble with your trading strategy? Here’s the #1 Mistake That Traders Make
GBP/USD Four Hour PRICE CHART (Oct 15 – DEC 4, 2019)
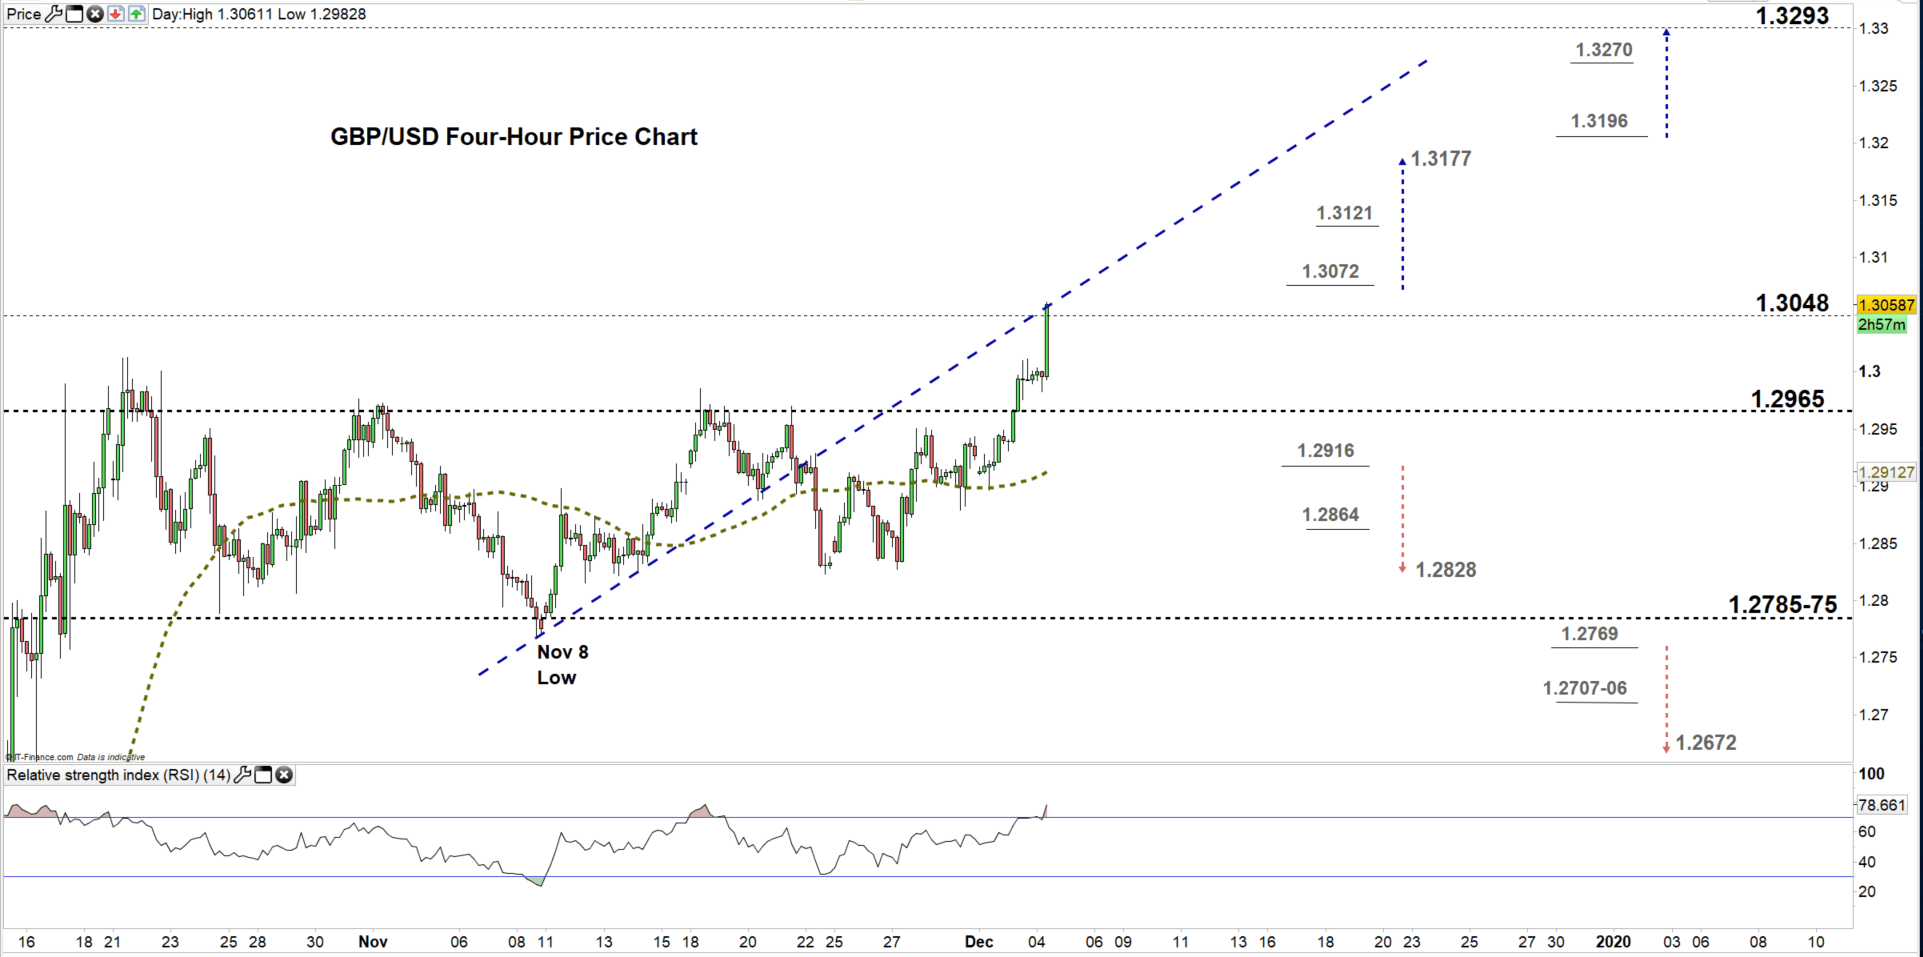
Looking at the four-hour chart, we notice today GBP/USD testes the uptrend line originated form the Nov 8 low 1.2768. The price may provide a bullish signal if closes beyond the trendline for two successive candlesticks.
A break above 1.3072 could lead GBPUSD towards 1.3177. Although, the weekly resistance level underlined on the chart should be kept in focus. On the other hand, a break below 1.2916 could send Cable towards 1.2828. Yet, the weekly support level underlined o the chart would be worth monitoring.
See the chart to find out more about key levels GBPUSD would encounter in a further bearish /bullish scenario.
Written By: Mahmoud Alkudsi
Please feel free to contact me on Twitter: @Malkudsi


