


GBP/USD Price Outlook
- British Pound price action against US Dollar.
- GBP/USD charts and analysis
Download for free our latest Q4 trading guides to help you build confidence when you trade on JPY, USD and other main currencies
GBP/USD Price – Locked in The Range
On Oct 21, GBP/USD rallied its highest level in over five months at 1.3012. Later, the price settled below 1.3000 handle then stuck in a sideways pattern creating higher highs with lower lows.
The Relative Strength Index (RSI) remained flat above 50, reflecting a stalled uptrend impulse.
Just getting started? See our Beginners’ Guide for FX traders
GBP/USD DAILY PRICE CHART (Nov 1, 2017 – Nov 20, 2019) Zoomed out

GBP/USD DAILY PRICE CHART (June 1 – Nov 7, 2019) Zoomed IN
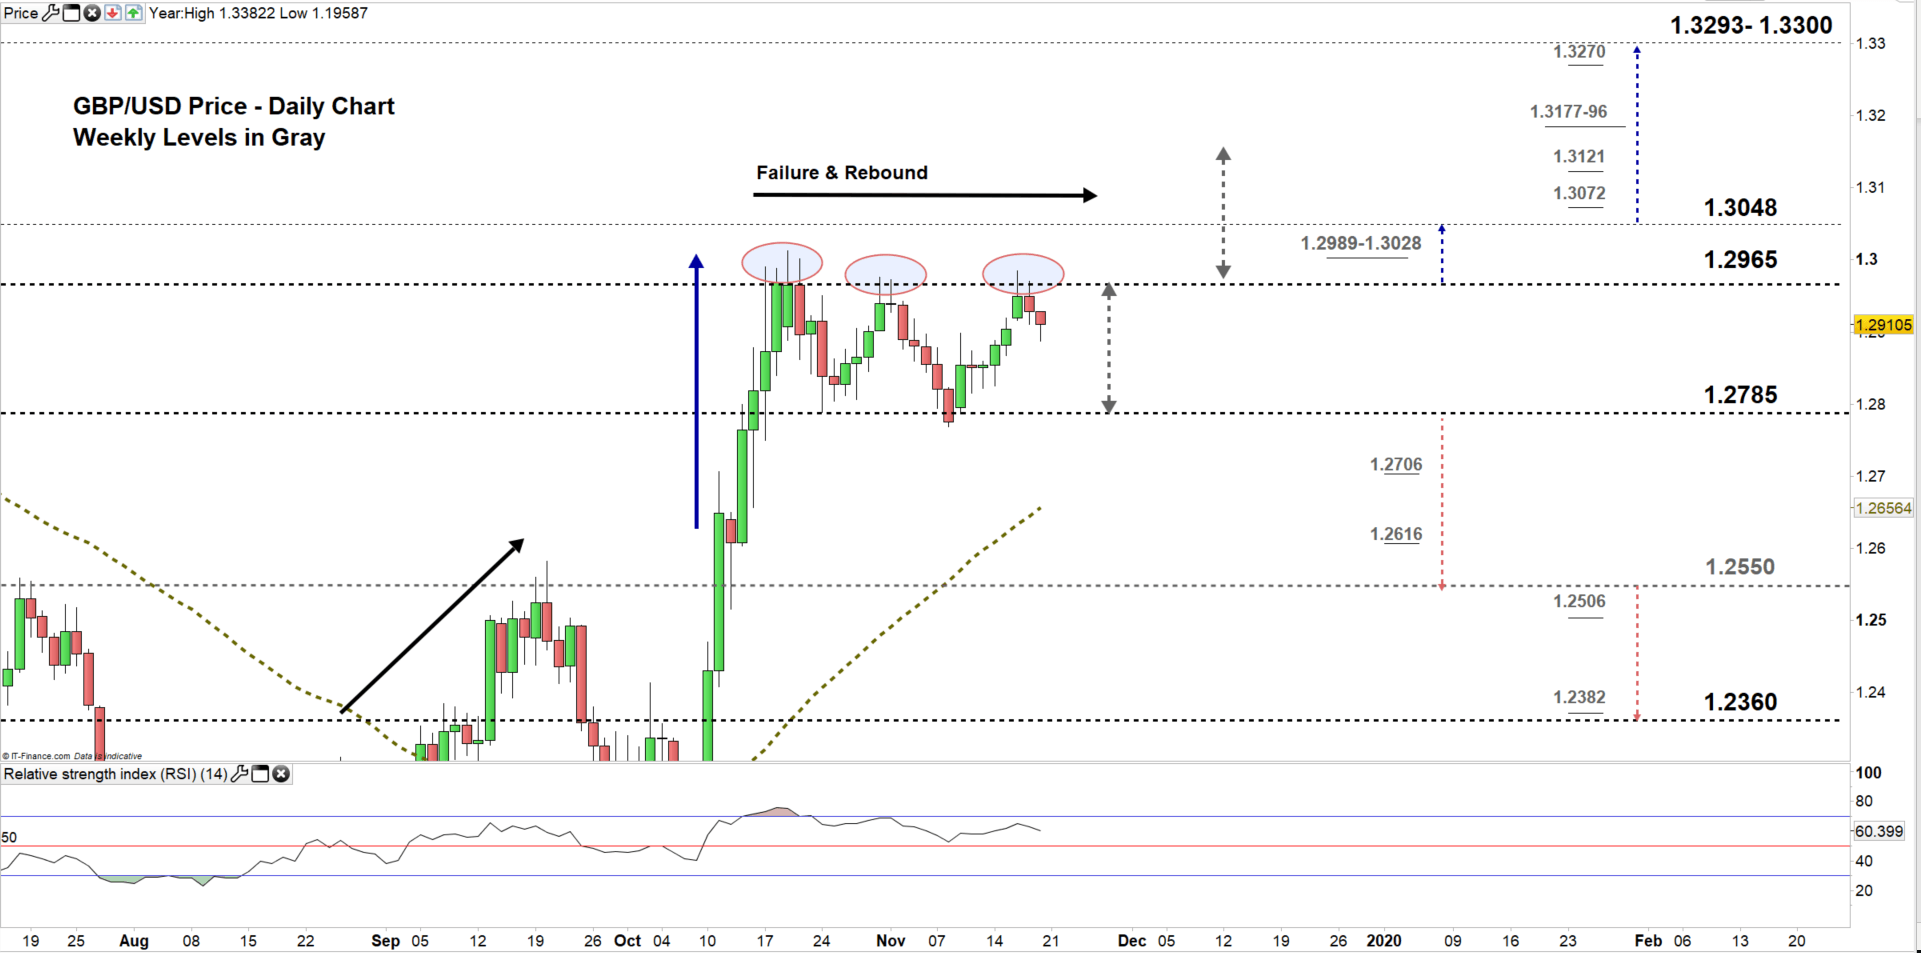
From the daily chart, we notice on Monday GBP/USD tested the high end of current trading zone 1.2785 – 1.2965. The price failed for the third time to rally to the higher trading zone as buyers took profit at this stage. This could weaken current momentum and press the pair towards the low end of the zone.
A close below the low end could break the deadlock and motivate sellers to lead GBPUSD towards 1.2550. Yet, the weekly support levels underlined on the chart should be watched closely.
On the flip -side, we notice at present GBPUSD creates a bullish rectangle pattern.Therefore, if the price closes on the opposite side, i.e. above the high end of the zone, this suggests buyers may push towards 1.3150. Although, the weekly resistance area and levels marked on the chart should be kept in focus.
Having trouble with your trading strategy? Here’s the #1 Mistake That Traders Make
GBP/USD Four Hour PRICE CHART (Oct 1 – Nov 7, 2019)
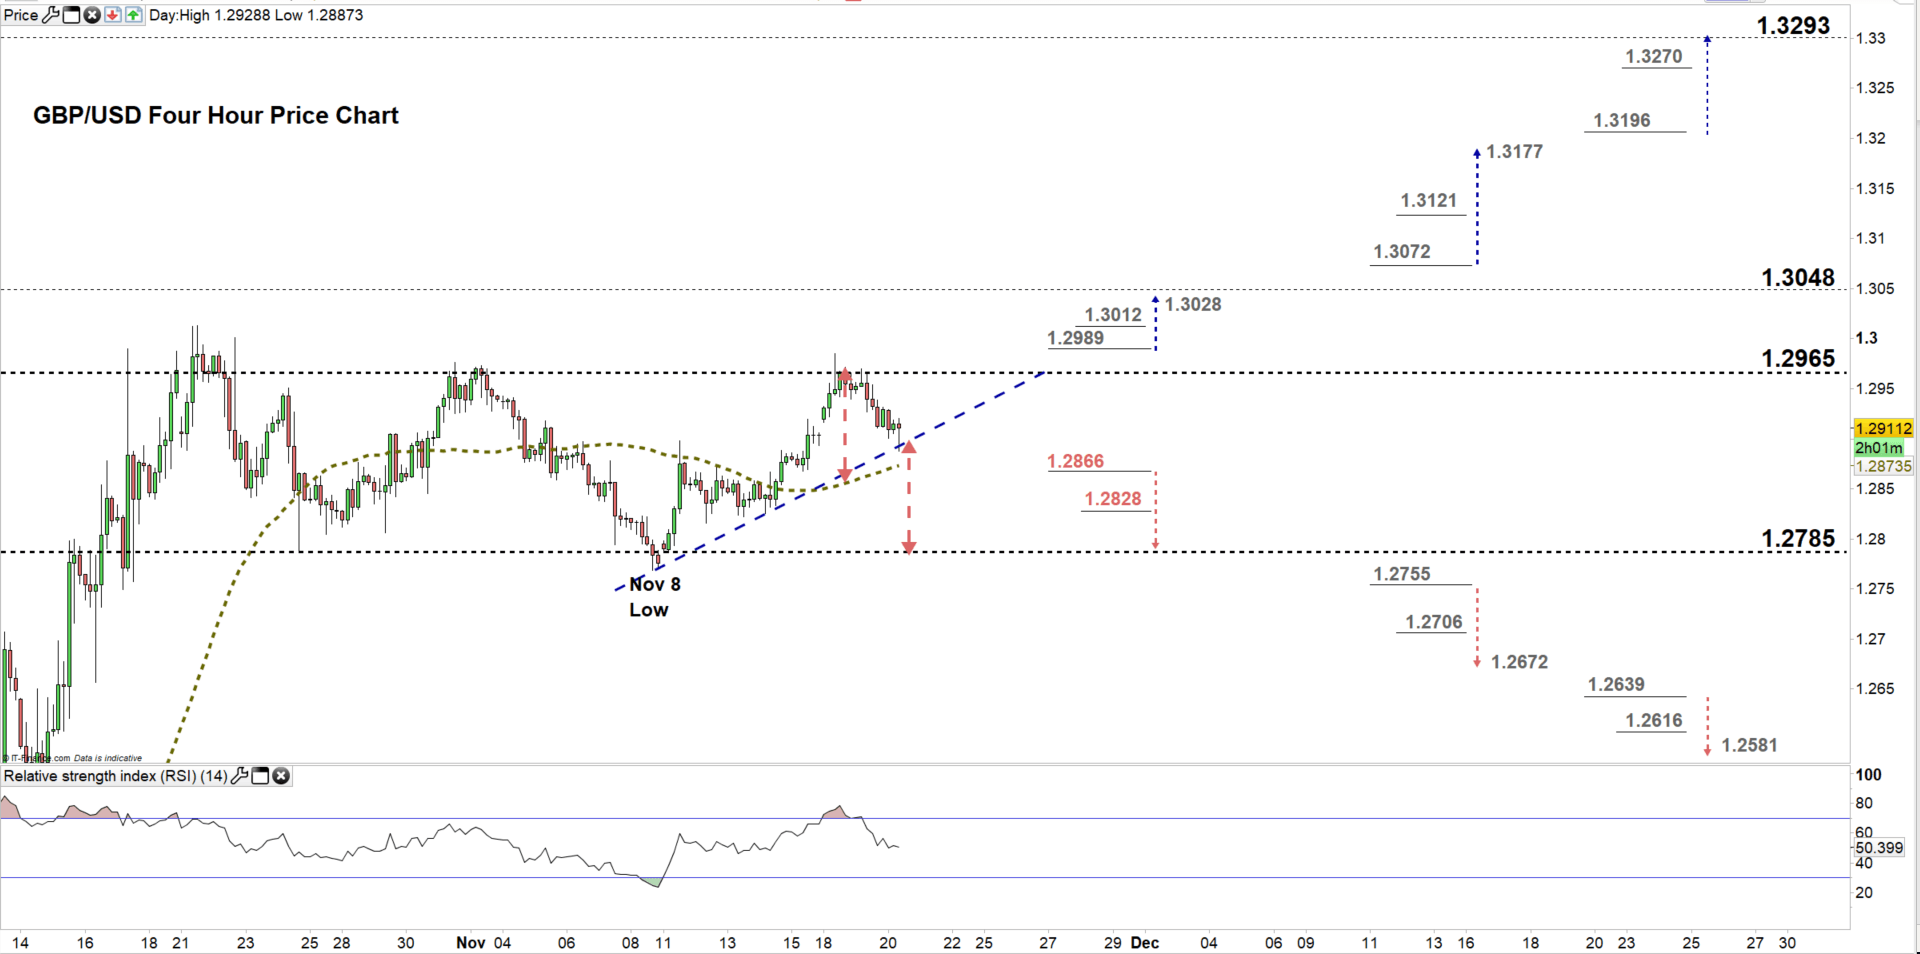
Looking at the four-hour chart, we notice today GBP/USD has tested the uptrend line originated form the Nov 8 Low at 1.2768.
Thus, a break below 1.2866 could send GBPUSD towards the low end of current trading zone discussed above on the daily chart. Nevertheless, the daily support level underscored on the chart should be considered. In turn, a break above 1.2989 could lead GBPUSD towards 1.3028. However, the weekly resistance level underlined on the chart would be worth monitoring
See the chart to find out more about key levels GBPUSD would encounter in a further bearish /bullish scenario.
Written By: Mahmoud Alkudsi
Please feel free to contact me on Twitter: @Malkudsi


