


GBP/USD Technical Analysis
- British Pound price action against US Dollar.
- GBP/USD charts and analysis
Download for free our latest Q4 trading guides to help you build confidence when you trade on JPY, USD and other main currencies
GBP/USD - Back to 1.2800
On Oct 31, GBP/USD corrected its uptrend move and created a lower high at 1.2976. The price declined after towards 1.2768 – its lowest level in over three weeks. However, this week the price has pulled back and settled above 1.2800.
The Relative Strength Index (RSI) has remained flat above 50 indicating to lack of impulse to resume uptrend move.
Just getting started? See our Beginners’ Guide for FX traders
GBP/USD DAILY PRICE CHART (Nov 14, 2017 – Nov 14, 2019) Zoomed out

GBP/USD DAILY PRICE CHART (AUG 20 – Nov 14, 2019) Zoomed IN
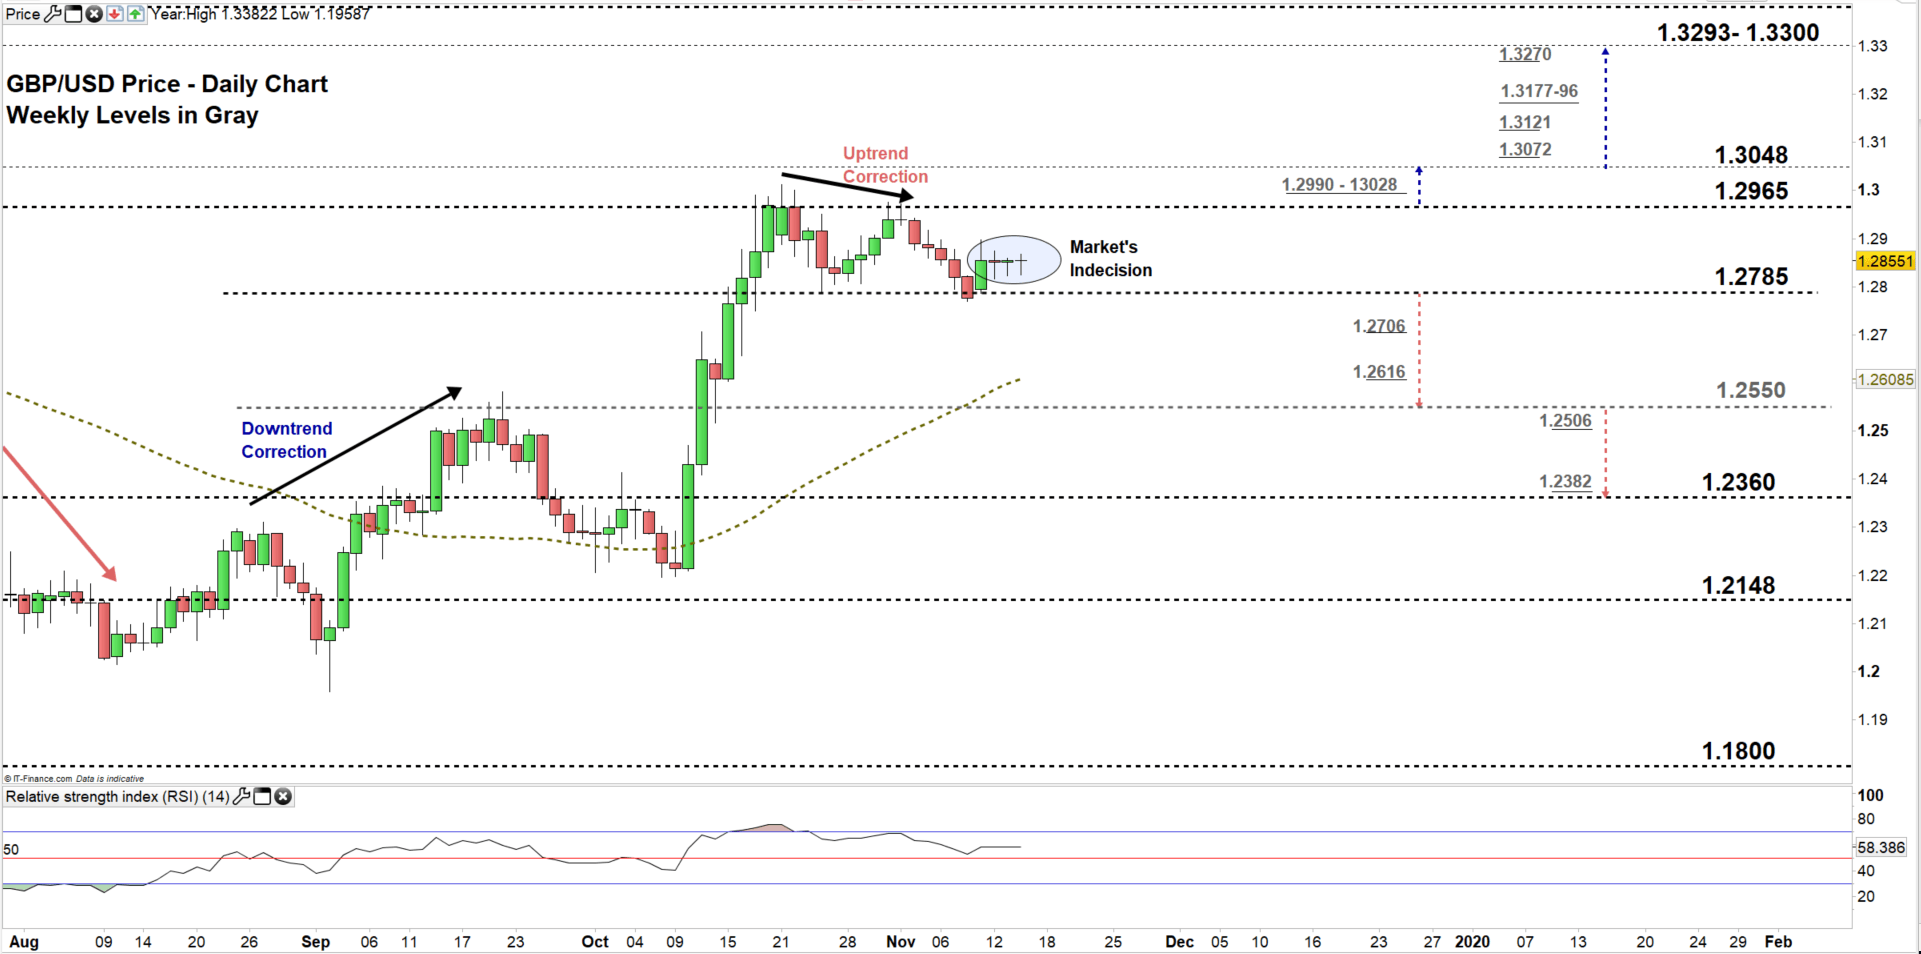
From the daily chart, we notice on Monday GBP/USD rallied back to the consolidation zone 1.2785 – 1.2965. Later, the price closed with two Doji patterns indicating the market’s indecision i.e. market’s participants are currently waiting for more signals to decide which side to take.
Thus, A close above the high end of the zone could motivate more buyers to get in to the market and push GBP/USD towards 1.3048. That said, the weekly resistance area marked on the chart (zoomed in) should be kept in focus.
On the other hand, a close below the low end of the zone, could persuade more sellers to lead the GBPUSD towards 1.2550. However, the weekly support levels underlined on the chart should be watched closely.
Having trouble with your trading strategy? Here’s the #1 Mistake That Traders Make
GBP/USD Four Hour PRICE CHART (Oct 15 – Nov 14, 2019)

Looking at the four-hour chart, we notice at the start of this week GBP/USD opened with a gap to the upside then rallied. Buyers stopped nearby 1.2900 handle.
Thus, a break above 1.2900 may send GBPUSD towards the high end of the aforementioned trading zone discussed above on the daily chart. Although, the daily resistance level underlined on the chart should be considered.
In turn, a break below 1.2755 could lead the GBPUSD towards 1.2672. Nevertheless, they need to keep an eye on the weekly support level underscored on the chart.
See the chart to find out more about key levels GBPUSD would encounter in a further bearish /bullish scenario.
Written By: Mahmoud Alkudsi
Please feel free to contact me on Twitter: @Malkudsi


