


GBP/USD Talking Points:
- GBP volatility took a break over the holidays as the early-December sell-off calmed and prices retraced a portion of their earlier-month losses. The year-end rally saw prices push above the 1.2800 handle, albeit temporarily on the final trading day of 2018; but since then bears have been back in-control to push below the 1.2600-handle.
- This is a big month for the British Pound as Brexit is expected to remain on centerstage. Two weeks from now brings the Parliament vote on Theresa May’s Brexit plan; which was widely-panned and called off in the face of impending failure just a few weeks ago. Theresa May survived the ensuing leadership challenge but the question remains – will she be able to get her Brexit plan through UK Parliament? And if not, are markets looking at a ‘Hard Brexit’ or ‘No Deal Brexit’ scenario?
- DailyFX Forecasts on a variety of currencies such as the US Dollar or the Euro are available from the DailyFX Trading Guides page. If you’re looking to improve your trading approach, check out Traits of Successful Traders. And if you’re looking for an introductory primer to the Forex market, check out our New to FX Guide.
Do you want to see how retail traders are currently trading the US Dollar? Check out our IG Client Sentiment Indicator.
GBP Bears Come Back to Ring in the New Year
The British Pound is trading lower on the day, further reversing a late-December rally that saw the pair test above the 1.2800 handle in the final trading session of 2018. Around that time, resistance began to show on the under-side of a prior bullish trend-line, and since then, bears have been in-charge with prices pushing back-below the 1.2600-handle. This constitutes a fresh two-week low in the pair, and it sets up GBP/USD in a rather vulnerable spot ahead of the Brexit vote in UK Parliament just a couple of weeks from now.
GBP/USD Four-Hour Price Chart
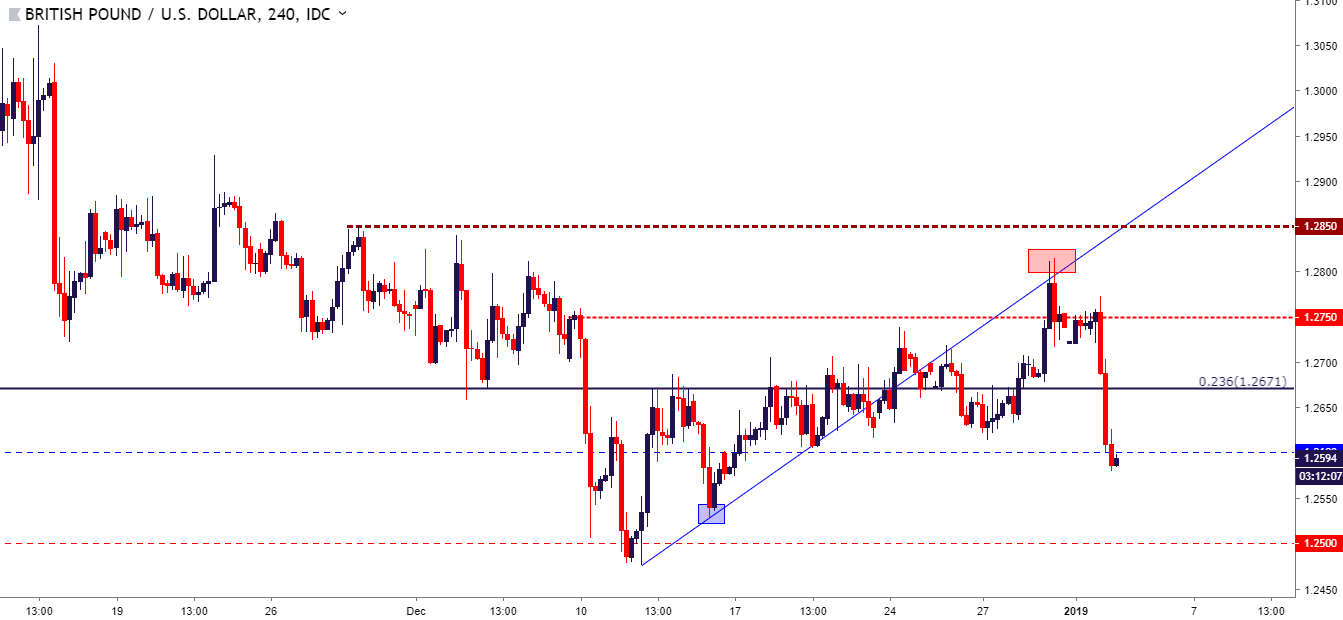
Chart prepared by James Stanley
Brexit risk remains around GBP-pairs as even a bright spot of data has been unable to reverse the tides. UK Manufacturing PMI was released at a 54.2 clip earlier this morning, well past the 52.5 expectation. Any value over 50 indicates expansion and a hearty beat of this nature will normally be construed in a positive manner. The fact that it wasn’t highlights how there’s a bigger issue surrounding the currency at the moment, and as discussed by my colleague Nick Cawley earlier this morning, that issue is Brexit and the utter opacity surrounding the situation.
Brexit was a key culprit behind GBP’s early-December sell-off; as GBP/USD plummeted down to fresh 18-month lows, testing below the 1.2500 level before support buyers stepped-in. But, as I had written in the aftermath of that support test, bearish strategies could remain as attractive as long as the pair remained below the 1.2850 level.
GBP/USD Daily Price Chart
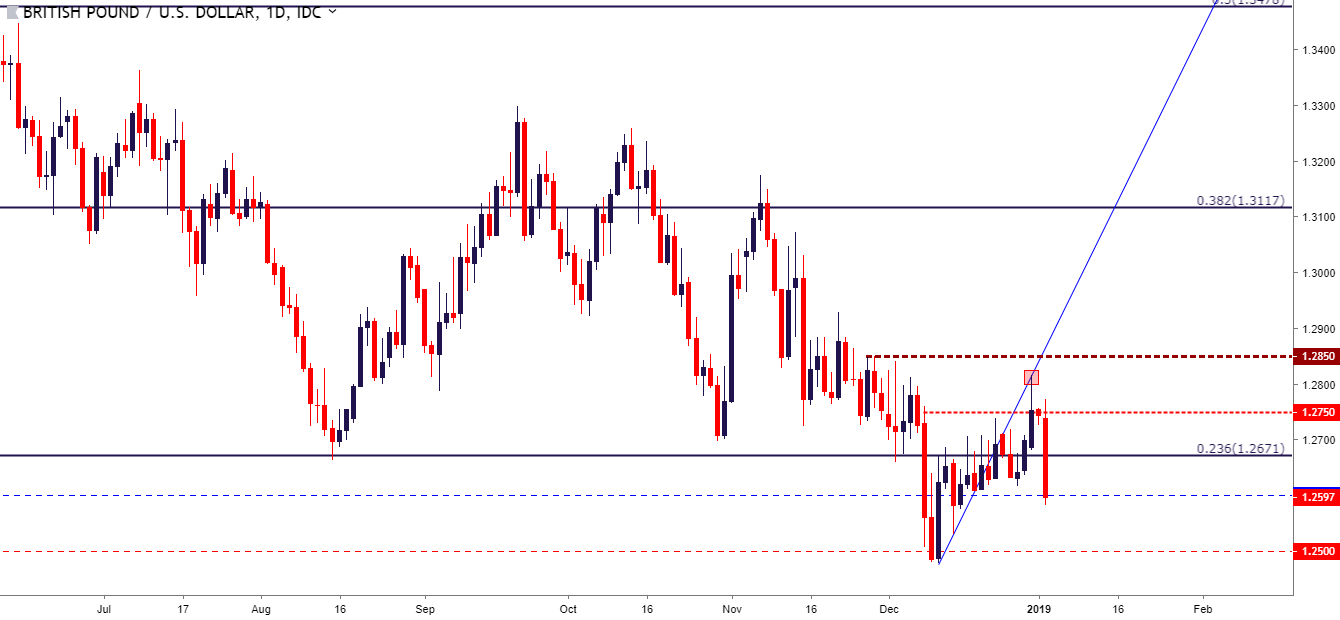
Chart prepared by James Stanley
GBP/USD Moving Forward: Threading the Needle
At this point, the primary complication with GBP/USD setups is the issue of chart position: Prices are now more than 200 pips away from that prior swing high while the 1.2500 level lurks less than 100 pips below. While the theme of GBP-weakness is attractive, it may not be probabilistic enough to accept such an adverse risk-reward scenario.
What could make the bearish theme attractive again is a re-test of the 1.2671 level, which is the 23.6% Fibonacci retracement of the ‘Brexit move’ in the pair. This is the price that helped to set the yearly low from mid-August into early-December; and this level had even helped to set resistance for about a week before buyers were finally able to push the pair above 1.2700. A re-test and show of resistance at the 1.2671 Fibonacci level could re-open the door for bearish strategies; targeting towards a re-test of the 1.2500-handle.
GBP/USD Four-Hour Price Chart
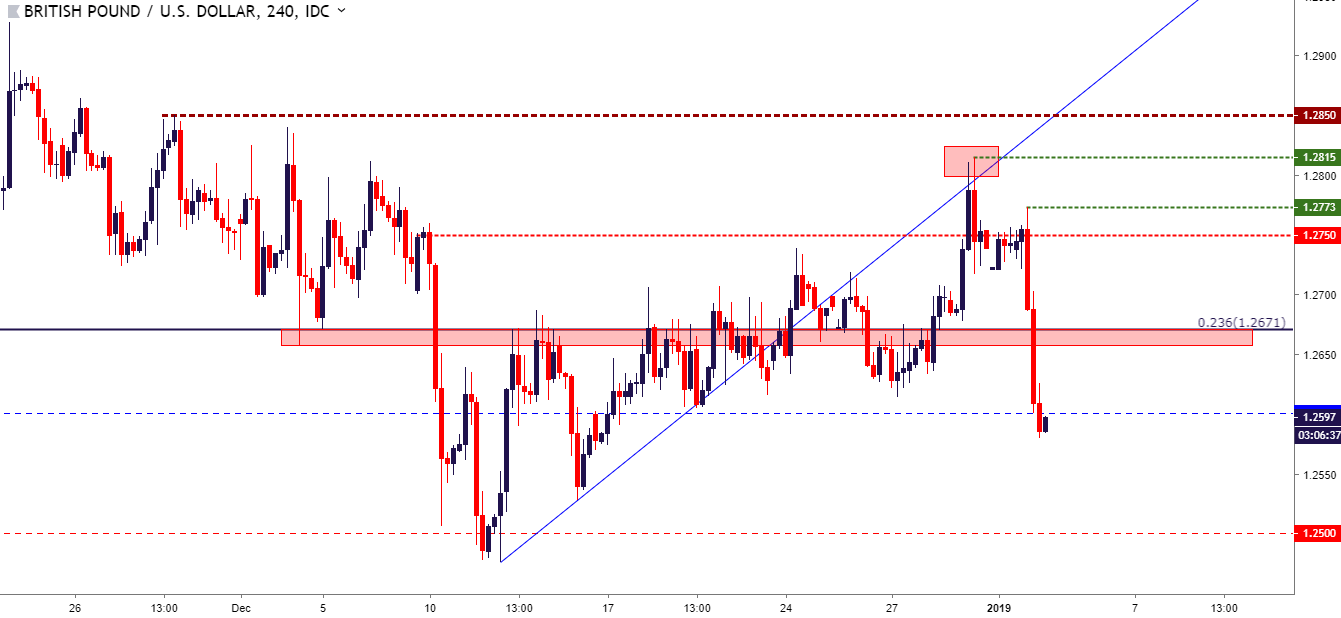
Chart prepared by James Stanley
To read more:
Are you looking for longer-term analysis on the U.S. Dollar? Our DailyFX Forecasts for Q4 have a section for each major currency, and we also offer a plethora of resources on USD-pairs such as EUR/USD, GBP/USD, USD/JPY, AUD/USD. Traders can also stay up with near-term positioning via our IG Client Sentiment Indicator.
Forex Trading Resources
DailyFX offers a plethora of tools, indicators and resources to help traders. For those looking for trading ideas, our IG Client Sentiment shows the positioning of retail traders with actual live trades and positions. Our trading guides bring our DailyFX Quarterly Forecasts and our Top Trading Opportunities; and our real-time news feed has intra-day interactions from the DailyFX team. And if you’re looking for real-time analysis, our DailyFX Webinars offer numerous sessions each week in which you can see how and why we’re looking at what we’re looking at.
If you’re looking for educational information, our New to FX guide is there to help new(er) traders while our Traits of Successful Traders research is built to help sharpen the skill set by focusing on risk and trade management.
--- Written by James Stanley, Strategist for DailyFX.com
Contact and follow James on Twitter: @JStanleyFX


