


To receive James Stanley’s Analysis directly via email, please sign up here.
Talking Points:
- GBP/USD Technical Strategy: Long-term mixed, intermediate-term bearish, near-term bullish.
- Cable price action broke down to re-test a key area of support that had previously functioned as resistance.
- If you’re looking for trading ideas, check out our Trading Guides. They’re free and updated for Q1, 2017. If you’re looking for ideas more short-term in nature, please check out our IG Client Sentiment.
In our last article, we looked at the continued strength in GBP/USD as the pair finally tested above the 1.3000 psychological area of resistance. On the under-side of price action, a rather clear support zone had popped-up around the 1.2750 psychological level; and this syncs with prior range resistance from the post-Flash crash backdrop in Cable. As the U.K. is just a week away from general elections, anxiety has begun to show as polls are indicating that Theresa May’s conservatives may end up losing seats from the venture: And this can make for an even messier ‘Brexit negotiation,’ with the decision to host early elections back-firing on the newly installed PM. As sellers took over in Cable, support showed-up at a familiar area around 1.2750; and at least for now, buyers have held the pair above prior range resistance.

Chart prepared by James Stanley
While this bounce off of support may be attractive for continuation themes on longer-term time frames, the bigger question is one of short-term momentum. This recent bounce off of the support zone around 1.2750 has catapulted price action into the under-side of a previously bullish trend-line, which can be found by connecting the post-Breakout swing-low with the low from May 15th. This should give bulls or those utilizing short-term bullish strategies reason to pause as this resistance coincides with prior support; giving rise to the idea that we may be looking at either a) range-bound conditions or b) a corrective swing-lower.
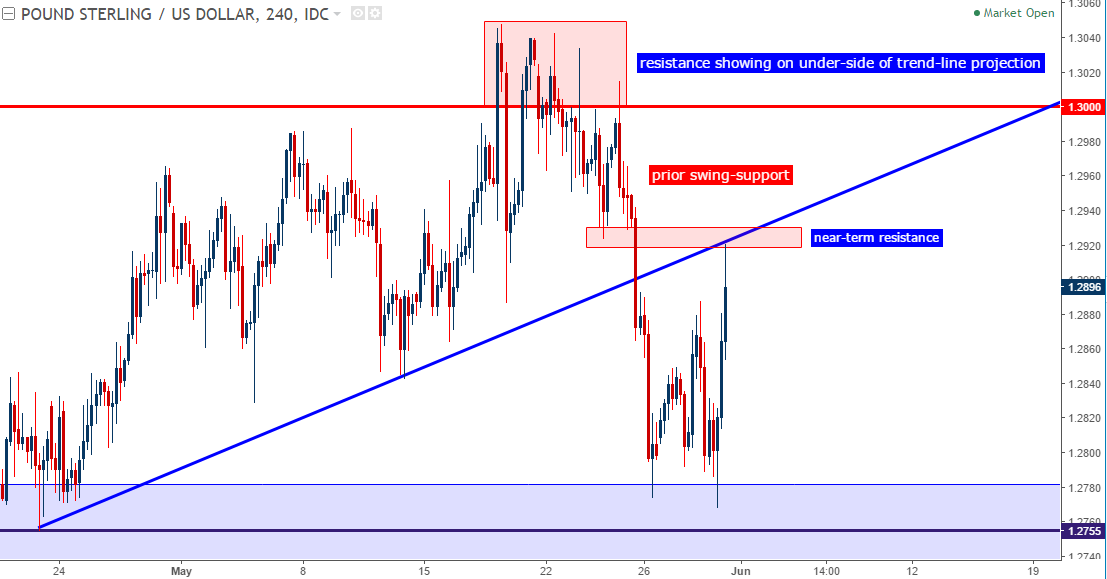
Chart prepared by James Stanley
For bullish approaches, or for those with a longer-term time horizon, waiting for a re-test of support could open the door to top-side swing strategies. The key here would be waiting for support to actually show around 1.2750-1.2775, as a 3rd test of a support zone usually brings diminishing marginal results unless something tangible has changed in the underlying conditions.
For those looking at shorter-term strategies, bearish reversals could be operable provided that risk is controlled. As we looked at in our last article, breaks-below the prior support level around 1.2825 could open the door to short-side setups, as bearish drive below these swing points illustrate waning bullish support that had previously driven cable to higher-highs and higher-lows. Taken with the near-term lower-low that printed earlier this morning, and those looking to execute short-term strategies could have a workable backdrop here in short Cable setups.

Chart prepared by James Stanley
--- Written by James Stanley, Strategist for DailyFX.com
To receive James Stanley’s analysis directly via email, please SIGN UP HERE
Contact and follow James on Twitter: @JStanleyFX


