


To receive James Stanley’s Analysis directly via email, please sign up here.
Talking Points:
- GBP/USD Technical Strategy: Intermediate-term – congested; short-term – bearish breakdown.
- Cable has just broken below a key trend-line, resolving a range that had built for most of February in the pair.
- If you’re looking for trading ideas, check out our Trading Guides. They’re free and updated for Q1, 2017. If you’re looking for ideas more short-term in nature, please check out our Speculative Sentiment Index Indicator (SSI).
In our last article, we looked at the continued congestion in Cable after GBP/USD had just broken-up to a fresh two-week high. But as we warned, sellers had come in at a key level around 1.2550, and buyers would likely want to wait, at the very least, until a break of the resistance level at 1.2582 took place before pressing bullish continuation strategies.
Since then, price action in the British Pound has broken down. Shortly after last week’s article, Cable settled back-down to prior area of support around 1.2400, and over the past 24 hours, a strong-run in the U.S. Dollar has elicited a breach of that prior batch of support. But just as we wanted to tap on the breaks for bullish continuation last week, traders may want to proceed with caution if investigating down-side continuation strategies, at least for now, as a key support level around 1.2250 sits just underneath current price action.

Chart prepared by James Stanley
The reason to temper that excitement is that the long-term chart on GBP/USD remains considerably oversold, with price action continue to run near 30-year lows. So while the prospect of continued down-side might seem attractive on shorter-term charts, continued moves-lower could elicit new buyers as Cable tests historic. For those looking to voice USD-strength strategies, there are likely more attractive areas to watch, at least with a longer-term vantage point.
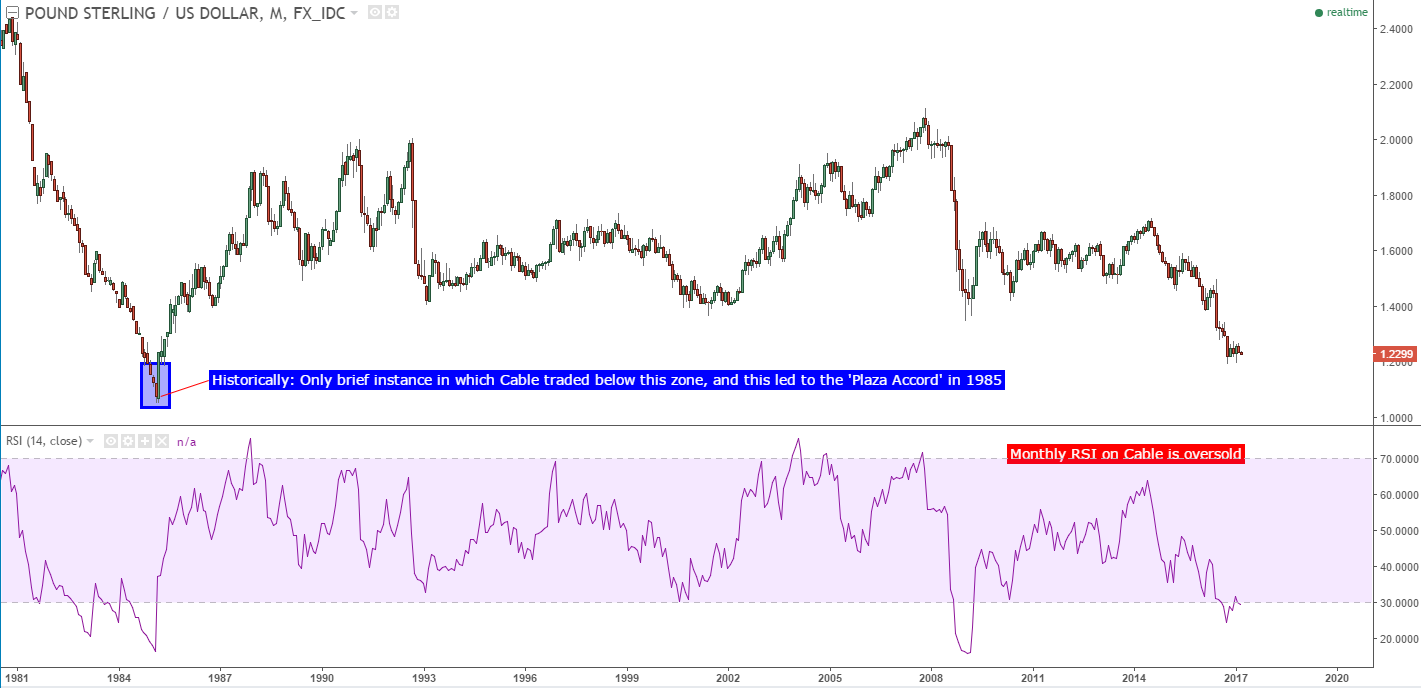
Chart prepared by James Stanley
For those that do want to move forward with shorter-term vantage points, a break of the key support zone at 1.2250 could open the door for near-term breakout strategies. For such an approach, traders would likely want to look to prior levels of interest to factor-out profit targets for such positions. Below, we take a look at a few zones of interest.

Chart prepared by James Stanley
--- Written by James Stanley, Analyst for DailyFX.com
To receive James Stanley’s analysis directly via email, please SIGN UP HERE
Contact and follow James on Twitter: @JStanleyFX


