


GBP price outlook
- Brexit news weigh more on Sterling pound price
- GBP/JPY price action.
Download for free our latest Q3 trading guides to help you build confidence when you trade on JPY, USD and other main currencies
GBP/JPY – Sellers in Charge
On Thursday GBP/JPY failed to close above 135.55 showing the buyers weakness to lead the price. On the following day the pair started to fall as expected in our previous update: British Pound May Keep Losing Mojo – Thanks to Bojo
The Relative Strength Index (RSI) on Thursday peaked at 43.5 then fell sharply to the oversold territory this week, emphasizing the seller’s domination.
Just getting started? See our Beginners’ Guide for FX traders
GBP/JPY DAILY PRICE CHART (Nov 22, 2016 – JULY 30, 2019) Zoomed out

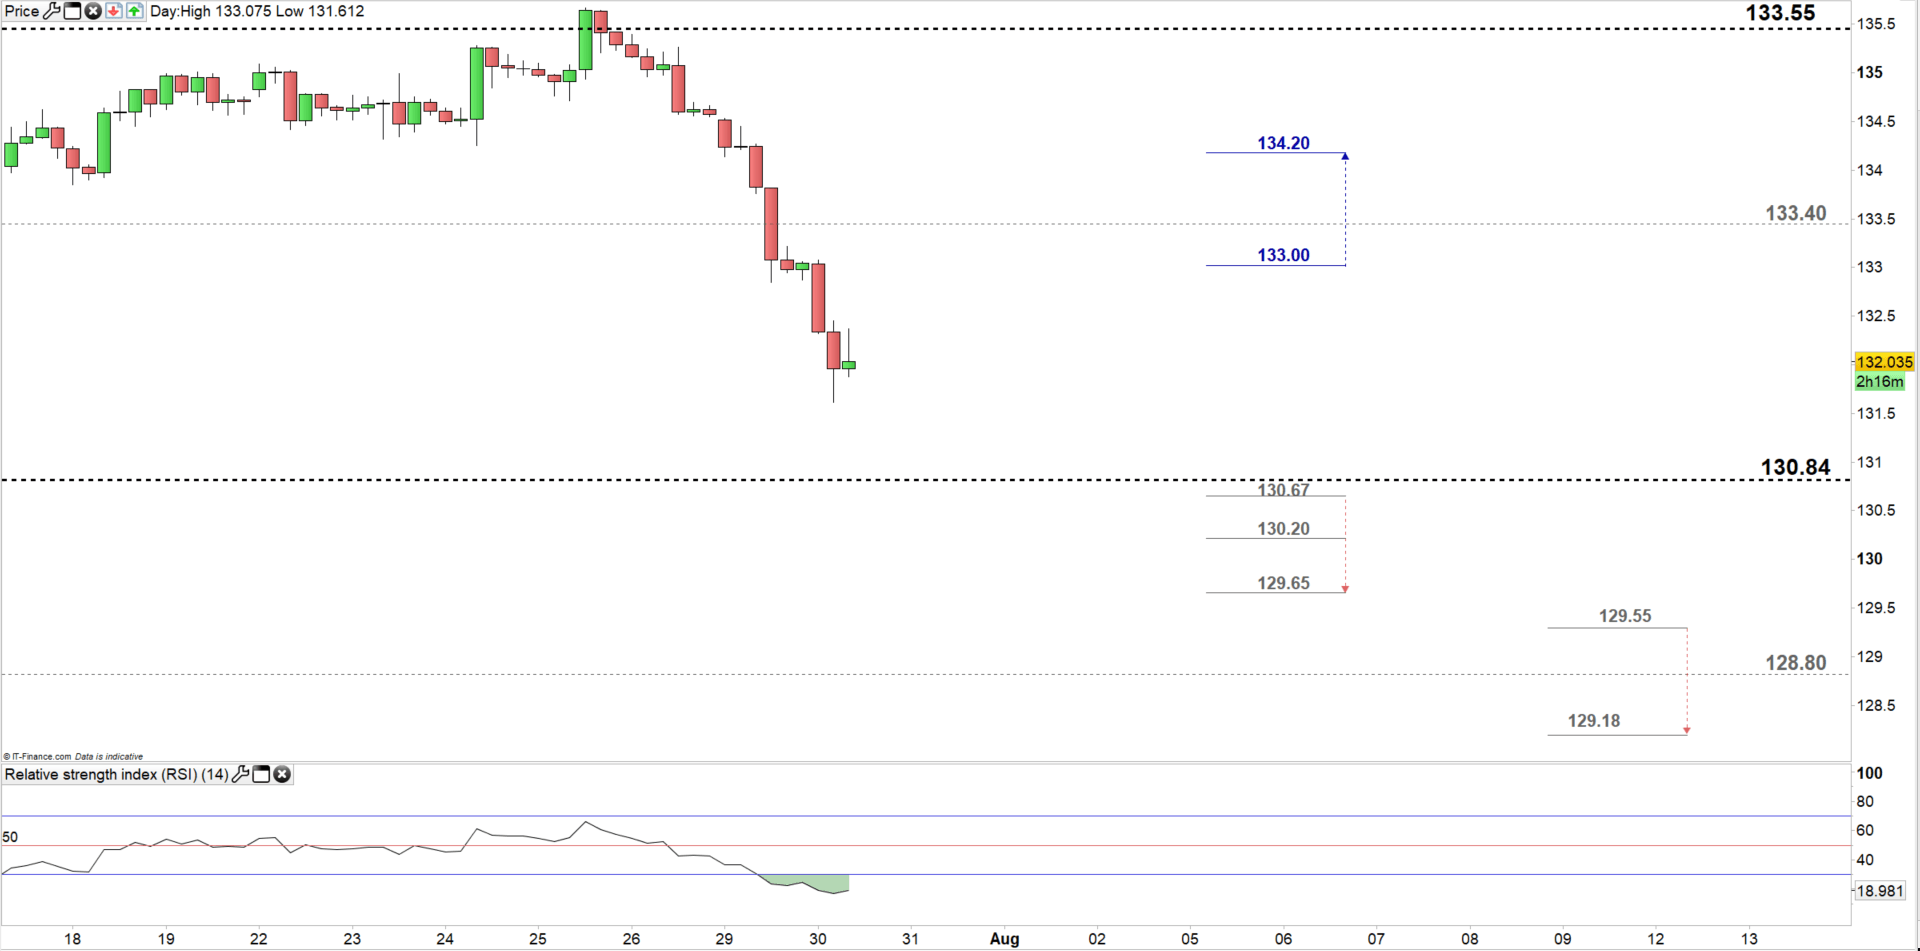
GBP/JPY DAILY PRICE CHART (Jun 17 – JULY 30, 2019) Zoomed IN
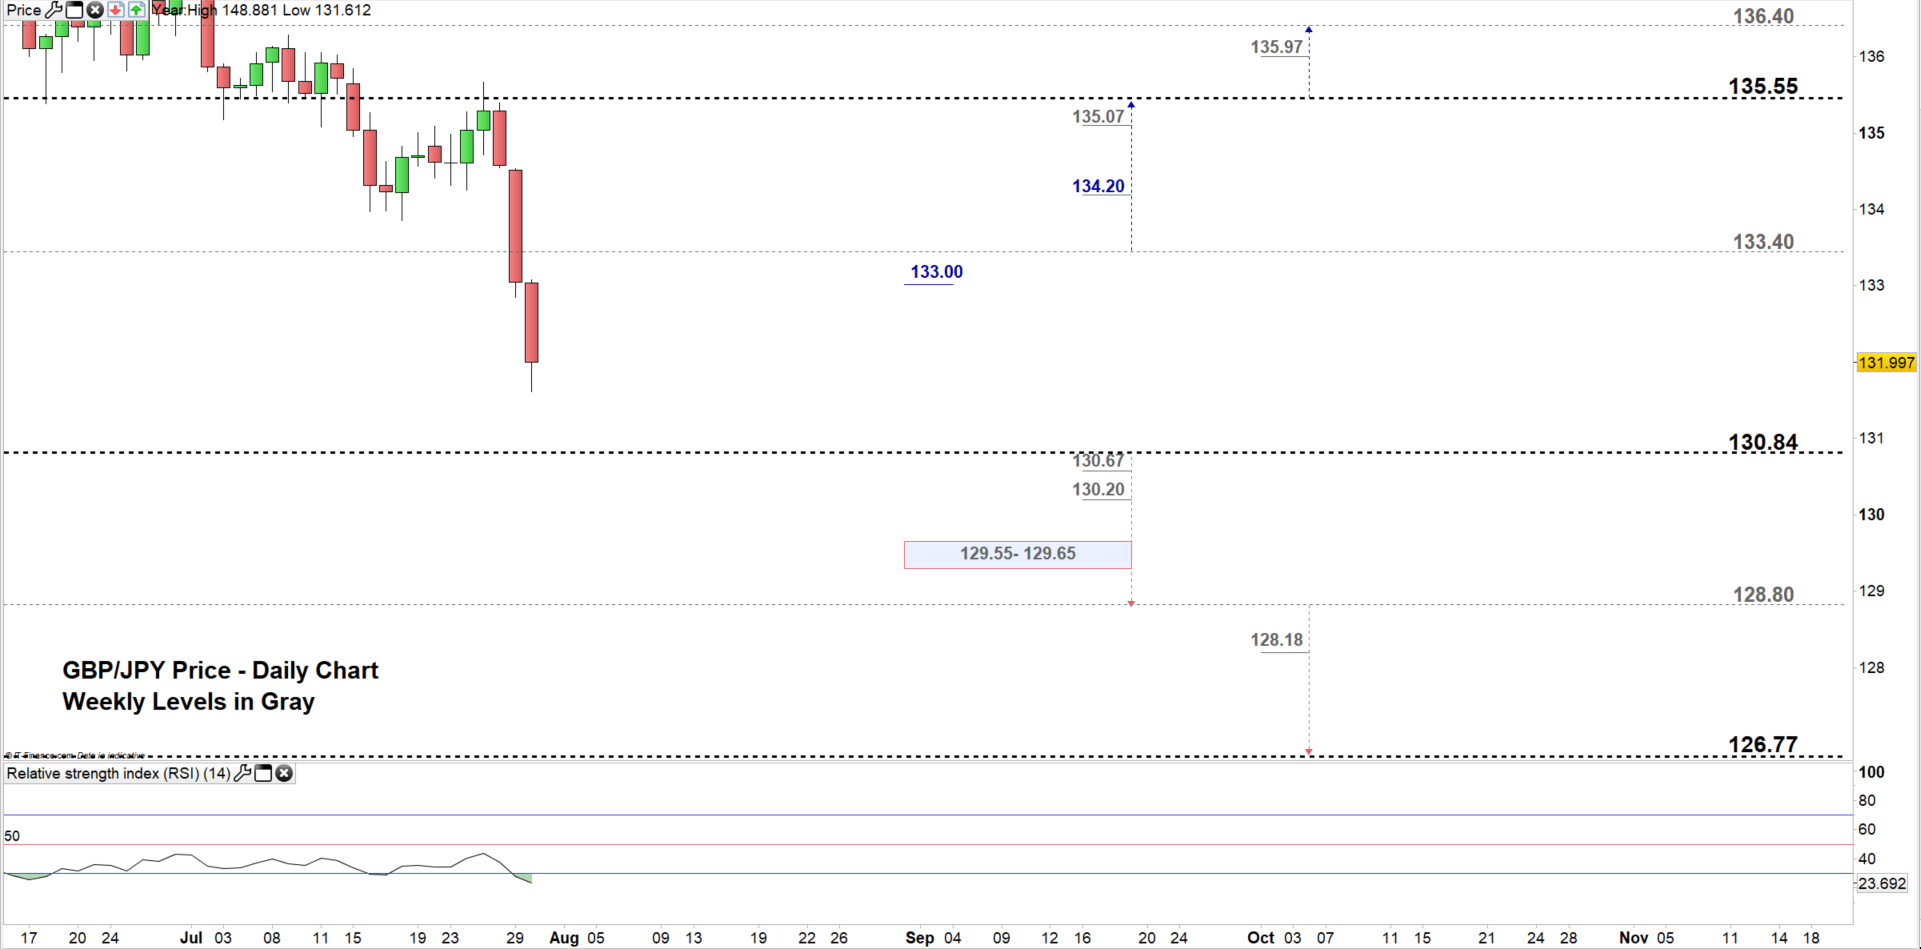
Looking at the daily chart, we notice on Monday GBP/JPY opened with a gap to the downside, then closed in the lower trading zone 130.84 – 133.40 increasing the bearish outlook of the pair.
Therefore, a close below the low end of this zone could press the price lower towards 128.80. However, the weekly support zone and levels highlighted on the chart (zoomed in) should be kept in focus. See the chart to know to find out more about the next trading zone with the weekly support level in a further bearish scenario.
On the flip-side, any close above the high end of the trading zone could lead the price towards 135.55. Although, the daily and weekly resistance levels marked on the chart (zoomed in) need to be watched along the way.
Having trouble with your trading strategy? Here’s the #1 Mistake That Traders Make
GBP/JPY Four-HOUR PRICE CHART (June 15 – July 30, 2019)
Looking at the four-hour chart, we notice yesterday GBP/JPY started a downside move after breaking below 133.85 and since then the pair lost near 1.4% of its value.
Hence, a break below 130.67 could mean more bearishness towards 129.65. However, the weekly support level underlined on the chart needs to be monitored. See the chart to know more about the following support levels the sellers may consider below mentioned levels.
On the other hand, a break above 133.00 handle may push the price towards 134.20, contingent on clearing the high end of the aforementioned trading zone.
Written By: Mahmoud Alkudsi
Please feel free to contact me on Twitter: @Malkudsi


