


GBP/JPY Price Forecast
See our free trading guide to help build confidence when you trade on JPY, USD and other main currencies Download for free our latest Q3 trading guides
GBP/JPY – Back to the Sideways Move
On July 15 GBP/JPY continued its downside move and on the following days printed new multi-month low at 133.85 . However, the price rallied after and Yesterday closed above 135.00 handle.
Alongside this, on July 17 the Relative Strength Index (RSI) U-turned from below 30 towards 35 then remained flat after, emphasizing the sellers losing momentum on one hand, and the buyers unable to be in charge on the other.
Just getting started? See our Beginners’ Guide for FX traders
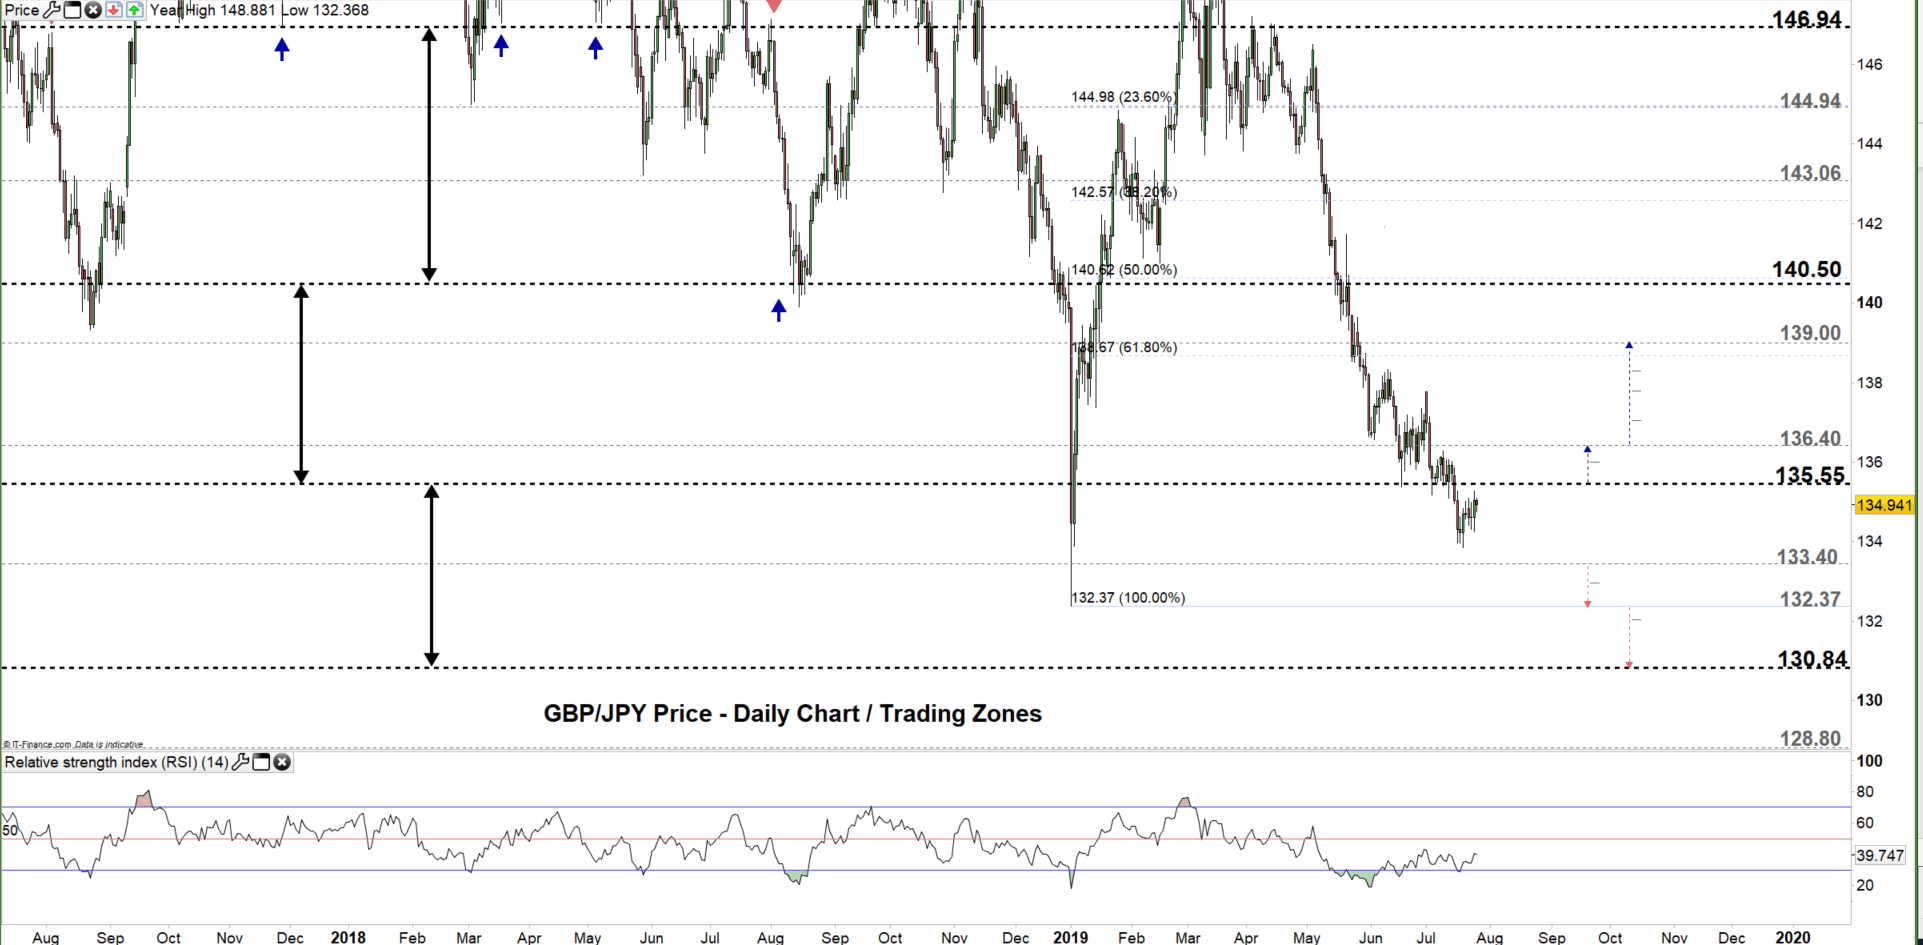
GBP/JPY DAILY PRICE CHART (July 25, 2017 – JULY 25, 2019) Zoomed out
GBP/JPY DAILY PRICE CHART (May 23 – JULY 25, 2019) Zoomed IN

Looking at the daily chart we notice last week GBP/JPY entered the lower trading zone 133.40 – 133.55 and stuck after in a trendless move. Yesterday, the pair printed its highest level in a week however, failed to test the high end of the current trading zone.
Therefore, if the buyers were successful to force a close above the high end of the zone, this may lead the price towards 136.40. Although, the weekly resistance level underlined on the chart (zoomed in) should be kept in focus.
On the flip-side, any failure to close above the high end of the zone this could send the price towards the low end. However, the weekly support level underscored on the chart needs to be monitored. See the chart (zoomed in) to know more about the next trading zone with the key support levels, if the sellers continue leading the price lower.
Having trouble with your trading strategy? Here’s the #1 Mistake That Traders Make
GBP/JPY Four-HOUR PRICE CHART (JuLY 4 – July 25, 2019)
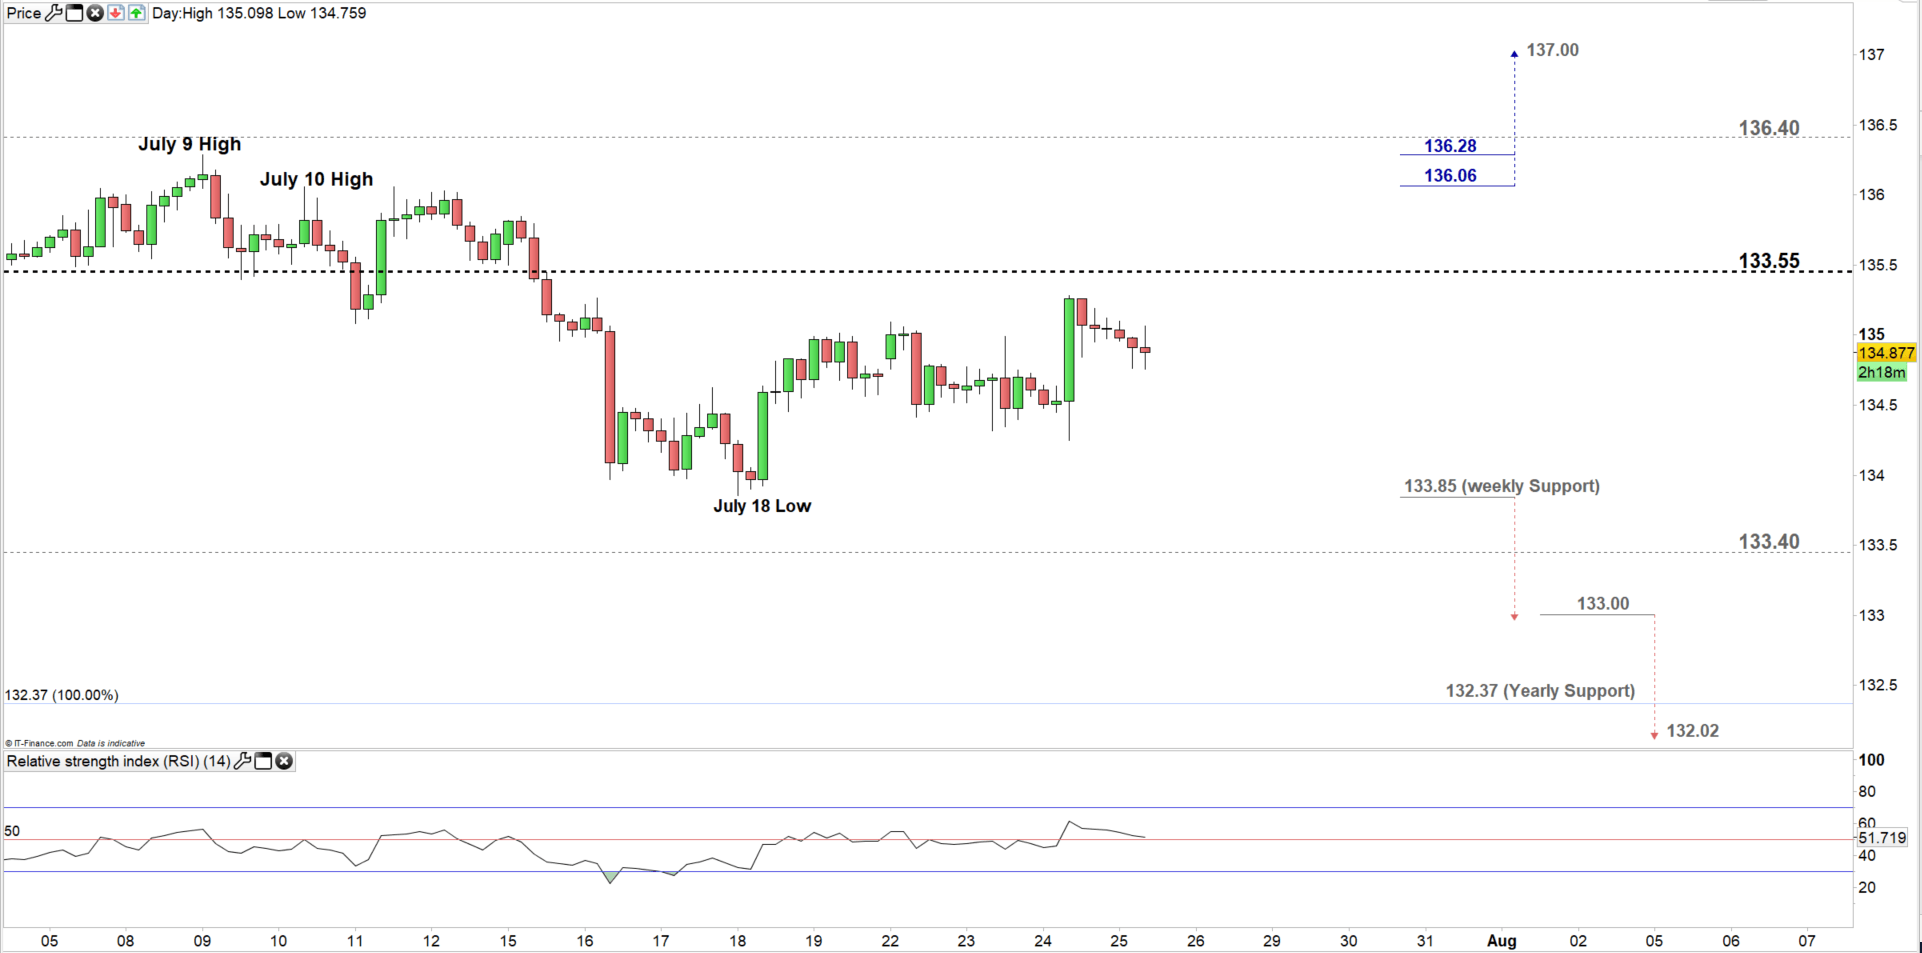
Looking at the four-hour chart, we notice on July 18 GBP/JPY rebounded from 133.85 then after traded without a clear direction creating lower lows with higher highs. Hence a break of this level (the weekly support) may press the pair to the downside sending the price towards 133.00. However, the end of the aforementioned trading zone needs to be considered. See the chart to find out more about the next significant support if the selloff continues below these levels.
In turn, a break above the July 10 high at 136.06 – the pair highest level in two weeks – may cause a rally towards 137.00. Nonetheless, the July 9 high with the weekly resistance level marked on the chart should be watched closely.
Written By: Mahmoud Alkudsi
Please feel free to contact me on Twitter: @Malkudsi


