


To receive James Stanley’s Analysis directly via email, please sign up here.
Talking Points:
- GBP/JPY Technical Strategy: Flat.
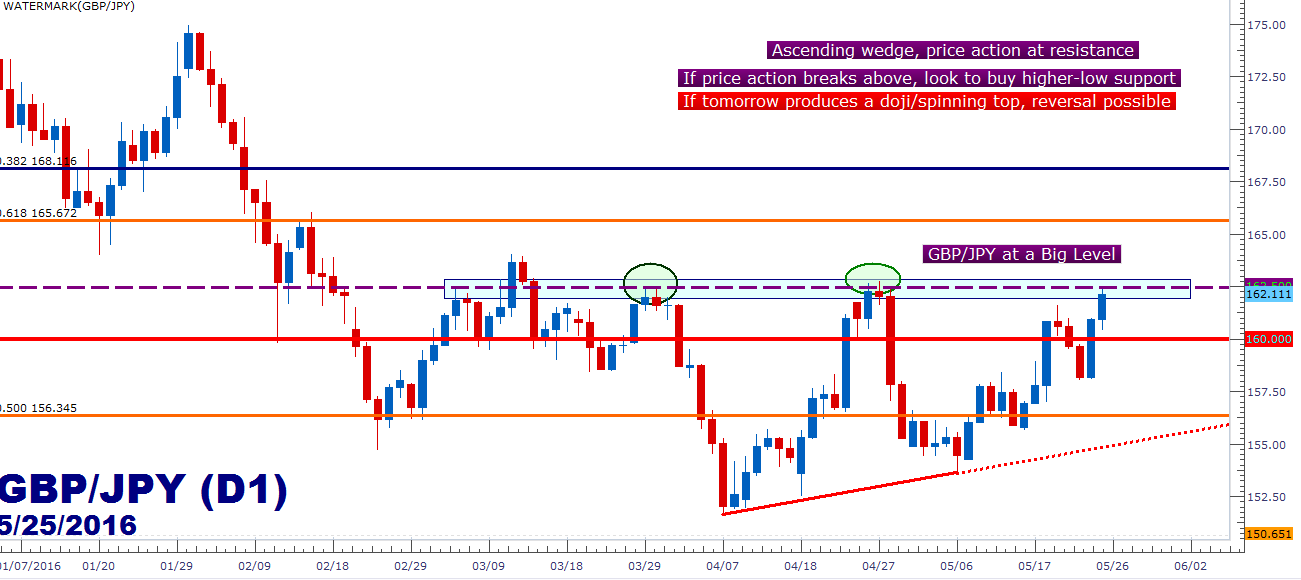
- GBP/JPY has lurched up to a familiar psychological resistance level at 162.50.
- If you’re looking for additional trade ideas, check out our Trading Guide and if you’re looking for shorter-term ideas, check out our SSI indicator.
The British Pound continues to impress as it appears that Brexit risks/fears have been getting more and more priced-out of the Sterling. We looked at the building up-trend in GBP/JPY in our last article just ahead of the Super Thursday batch of announcements; and since then that bullish structure has only furthered as the pair has put in even more higher-highs and higher-lows.
But this morning saw a critical price action level come in to play, as this is the major psychological level that’s capped GBP/JPY price action for the better part of the past two months at 162.50. We’ve had two different major resistance inflections off of this level of recent, first on March 29-30th and then again on April 27-28th. Each instance led to a decline of at least 800 pips.
But this isn’t entirely a one-sided thesis, as the pair has also been building in higher-lows since the beginning of April; so a case for further bullishness could certainly be made.
At this point, traders are likely going to want to observe price action’s behavior around this level. If we can get a significant break above 162.50 (specifically a high above 162.80), then we have a fresh two-month high in the pair; and at that point traders can then begin to strategize long positions by looking to trigger as price moves down to a higher-low support value.
Conversely, should price action show resistance at this level over the next day, printing a doji or spinning top for Thursday’s daily bar, then we have the thesis that traders are selling off of this level and this may, again, come in as resistance. At that point, the short-side setup could be investigated with the thesis of trading a reversal in the pair.
Created with Marketscope/Trading Station II; prepared by James Stanley
--- Written by James Stanley, Analyst for DailyFX.com
To receive James Stanley’s analysis directly via email, please SIGN UP HERE
Contact and follow James on Twitter: @JStanleyFX


