


Talking Points
- The CAC 40 is Trading Down -1.91% on CPI Figures
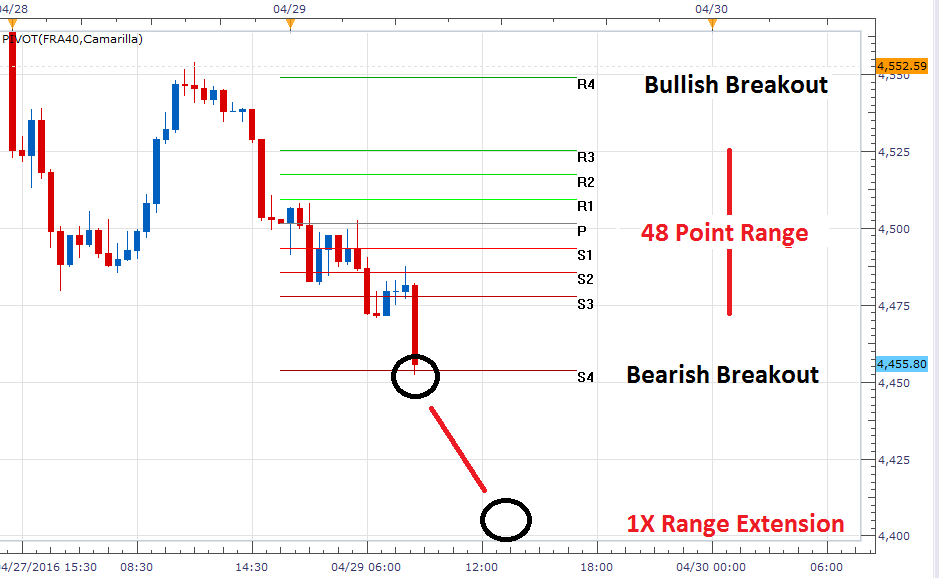
- Bearish Breakouts for Today Begin Under 4,453
- Sentiment has Shifted Positive, Reading +1.91
CAC 40 30 Minute Chart
(Created using Marketscope 2.0 Charts)
What’s next for the stock market? Find out more with our analysts Free forecast!
The CAC 40 is trading down -1.91%, after Euro-Zone CPI figures were released worse than expected this morning. Expectations were set at -0.1% (YoY) (APR). However, this estimated was missed with a release of -0.2%, causing stocks to decline. At this point, most major European indices are trading down for the day. This includes the DAX 30 and FTSE 100, which are all poised to close lower on the session. For the CAC 40, BNP Pariabs is leading today’s decline trading down -3.39% on the day.
Technically, the CAC 40 is now trading near its daily S4 Camarilla pivot at a price of 4,453. If prices continue to decline beneath this value, traders may look for potential breakout entries near this point. By extrapolating a 1X extension of today’s 48 point range, initial bearish breakout targets may be found near 4,405. In the event that support holds, traders may alternatively look for prices to bounce back inside of today’s pivot range. This range begins near 4,477 with the S3 pivot and ends at the R3 pivot at a price of 4,525. In this scenario, any current bearish momentum would be considered invalidated.
Find out real time sentiment data with the DailyFX’s sentiment page.
SSI (speculative sentiment index) for the CAC 40 (Ticker: FRA40) currently reads at +1.91. This is a major shift from Wednesday’s reading of -1.28. With over 65% of positions long, traders looking at SSI as a contrarian indicator may look for further price declines on the Index. If prices do continue to drop, it would be expected to see SSI to reach an extreme of +2.0 or more. Alternative, in the event of a bullish reversal, SSI would be expected to decline back towards more neutral readings.
To Receive Walkers’ analysis directly via email, please SIGN UP HERE
See Walker’s most recent articles at his Bio Page.
Contact and Follow Walker on Twitter @WEnglandFX.


