


Euro, EUR/USD, EUR/JPY, EUR/GBP, IGCS – Talking Points:
- EUR/USD probing 6-week range support.
- EUR/JPY continuing to track 10-month uptrend higher.
- EUR/GBP at risk of further losses after collapsing through Symmetrical Triangle support.

The Euro is testing a multitude of pivotal support levels against its major counterparts, which could see it extend its recent losses. However, if these inflections points hold, there is a distinct possibility that EUR could regain lost ground in the coming days. Here are the key levels to watch for EUR/USD, EUR/JPY and EUR/GBP rates.
EUR/USD Daily Chart – 6-Week Support Range Coming Under Pressure
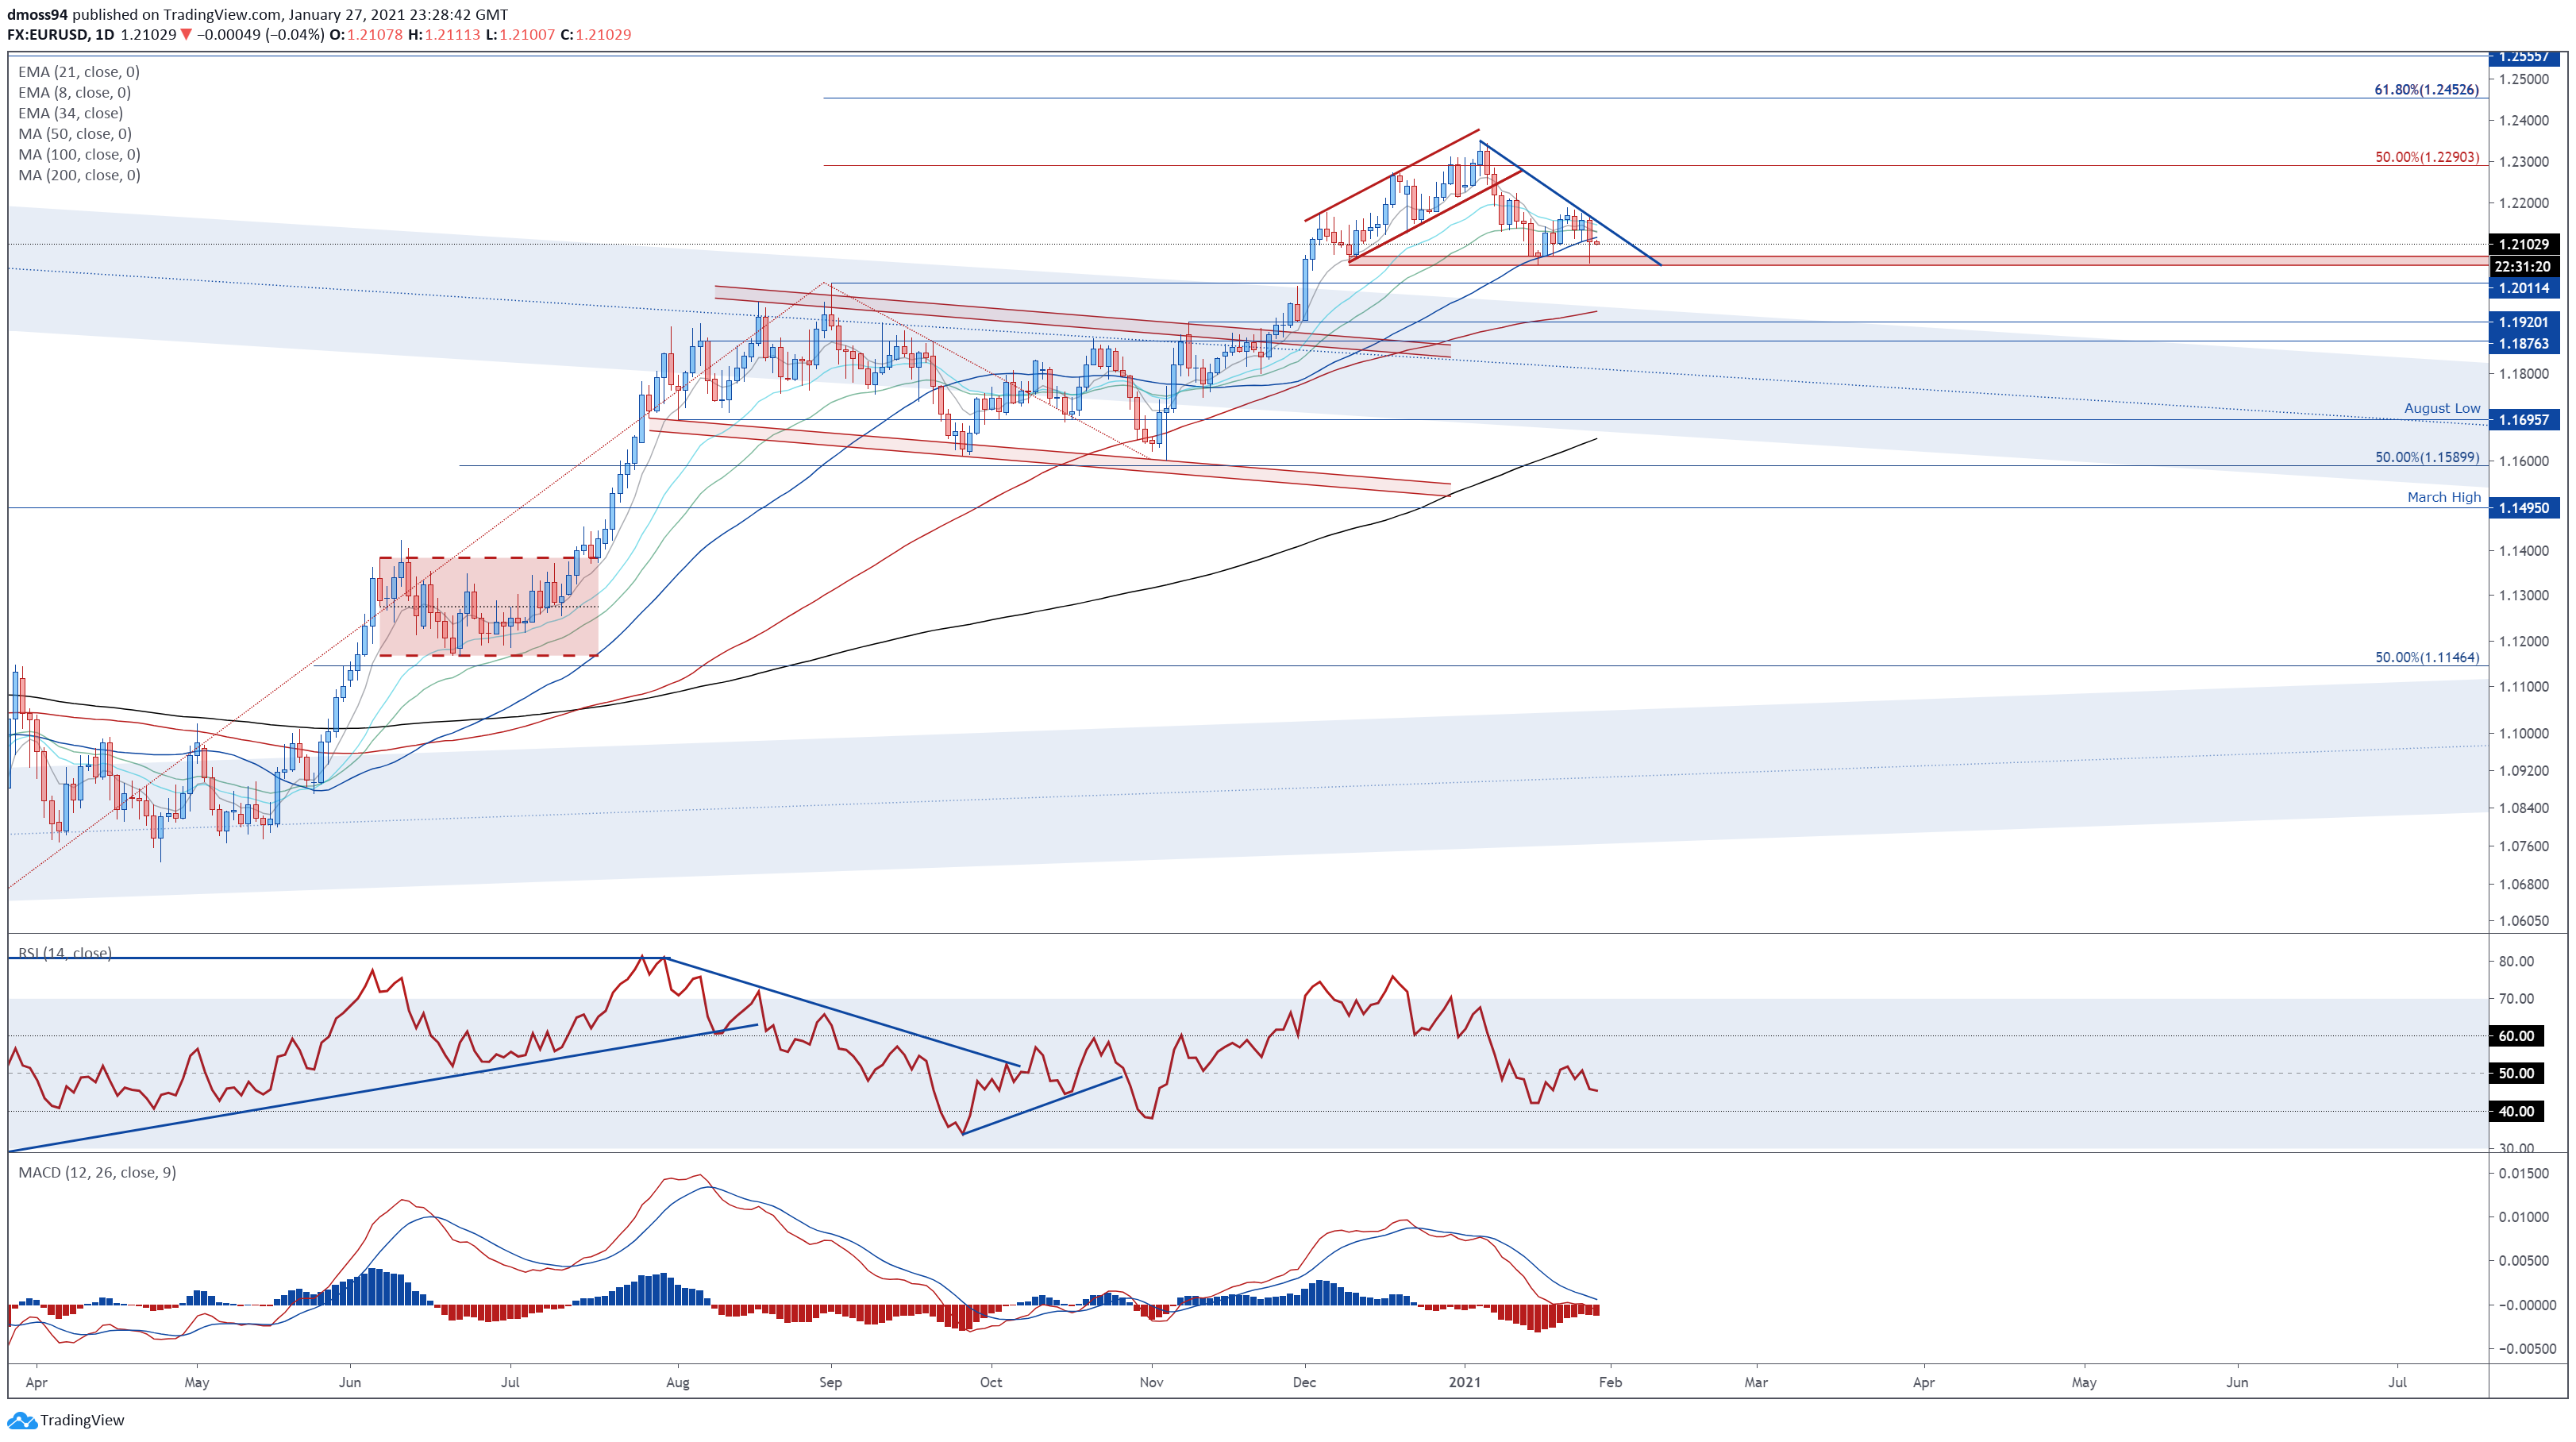
EUR/USD daily chart created using Tradingview
EUR/USD rates could be at risk of further losses in the short term, as price slides below the trend-defining 50-day moving average (1.2119) to challenge the key support range at 1.2055 – 1.2075.
With the slopes of all three exponential moving averages – 8-, 21- and 34-period – notably turning lower, and the RSI dipping below 50, the path of least resistance seems lower.
A daily close below 1.2050 would probably trigger a more extended pullback towards the 100-DMA (1.1945) and former resistance-turned-support at the November 9 high (1.1920). Clearing that could pave the way for sellers to drive the exchange rate back towards the sentiment-defining 200-MA and August low (1.1696).
However, if range support remains intact, a rebound higher could be on the cards. A daily close above the downtrend extending from the yearly high and 8-EMA (1.2131) would likely neutralize near-term selling pressure and open the door for buyers to probe the January high (1.2349).
Hurdling that probably signals the resumption of the primary uptrend and brings the 61.8% Fibonacci (1.2453) into focus.
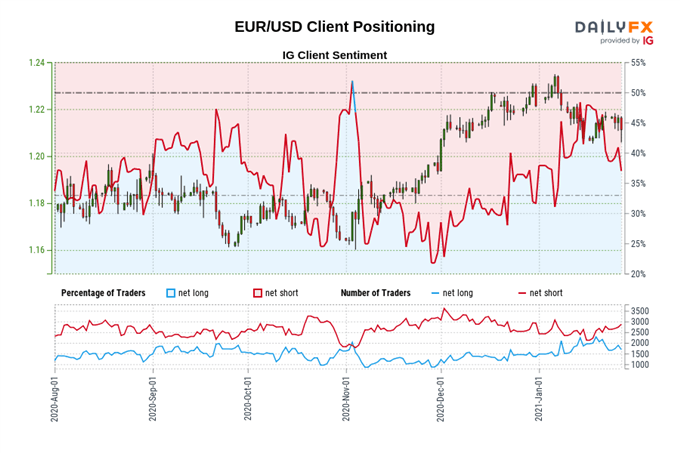
The IG Client Sentiment Report shows 44.35% of traders are net-long with the ratio of traders short to long at 1.25 to 1. The number of traders net-long is 12.66% higher than yesterday and 10.78% lower from last week, while the number of traders net-short is 15.22% lower than yesterday and 5.57% lower from last week.
We typically take a contrarian view to crowd sentiment, and the fact traders are net-short suggests EUR/USD prices may continue to rise.
Positioning is less net-short than yesterday but more net-short from last week. The combination of current sentiment and recent changes gives us a further mixed EUR/USD trading bias.
EUR/JPY Daily Chart – Uptrend from March 2020 Nadir Capping Downside

EUR/JPY daily chart created using Tradingview
EUR/JPY rates, on the other hand, appear poised to continue gaining ground in the near term, as price holds constructively above the trend-defining 50-MA (125.80) and the uptrend extending from the March 2020 low remains intact.
With the exchange rate tracking above all 6 moving averages, and the MACD gearing up to cross back above its ‘slower’ signal line counterpart, further gains seem likely.
Gaining a firm foothold above the January 25 high (126.37), on a daily close basis, would probably pave the way for a retest of the yearly high (127.49). Breaching that likely brings the 38.2% Fibonacci (128.52) into the crosshairs.
Conversely, piercing through 125.50 could intensify selling pressure in the short term and result in a pullback to range support at 124.95 – 125.05.
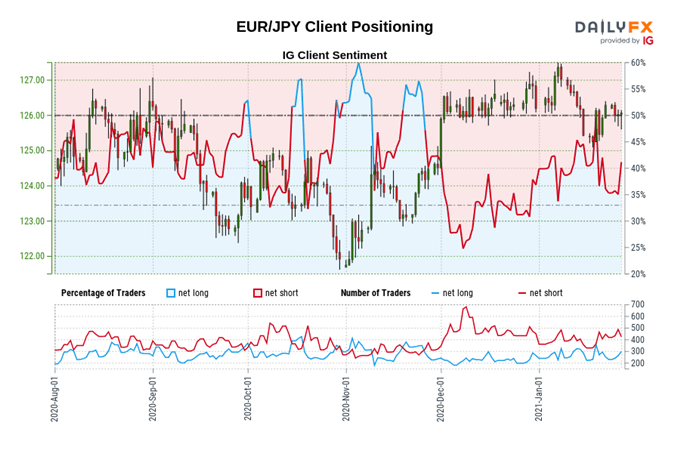
The IG Client Sentiment Report shows 37.21% of traders are net-long with the ratio of traders short to long at 1.69 to 1. The number of traders net-long is 14.29% lower than yesterday and 9.09% lower from last week, while the number of traders net-short is 2.88% lower than yesterday and 0.25% lower from last week.
We typically take a contrarian view to crowd sentiment, and the fact traders are net-short suggests EUR/JPY prices may continue to rise.
Traders are further net-short than yesterday and last week, and the combination of current sentiment and recent changes gives us a stronger EUR/JPY-bullish contrarian trading bias.
EUR/GBP Daily Chart – Symmetrical Triangle Break Hints at Further Losses
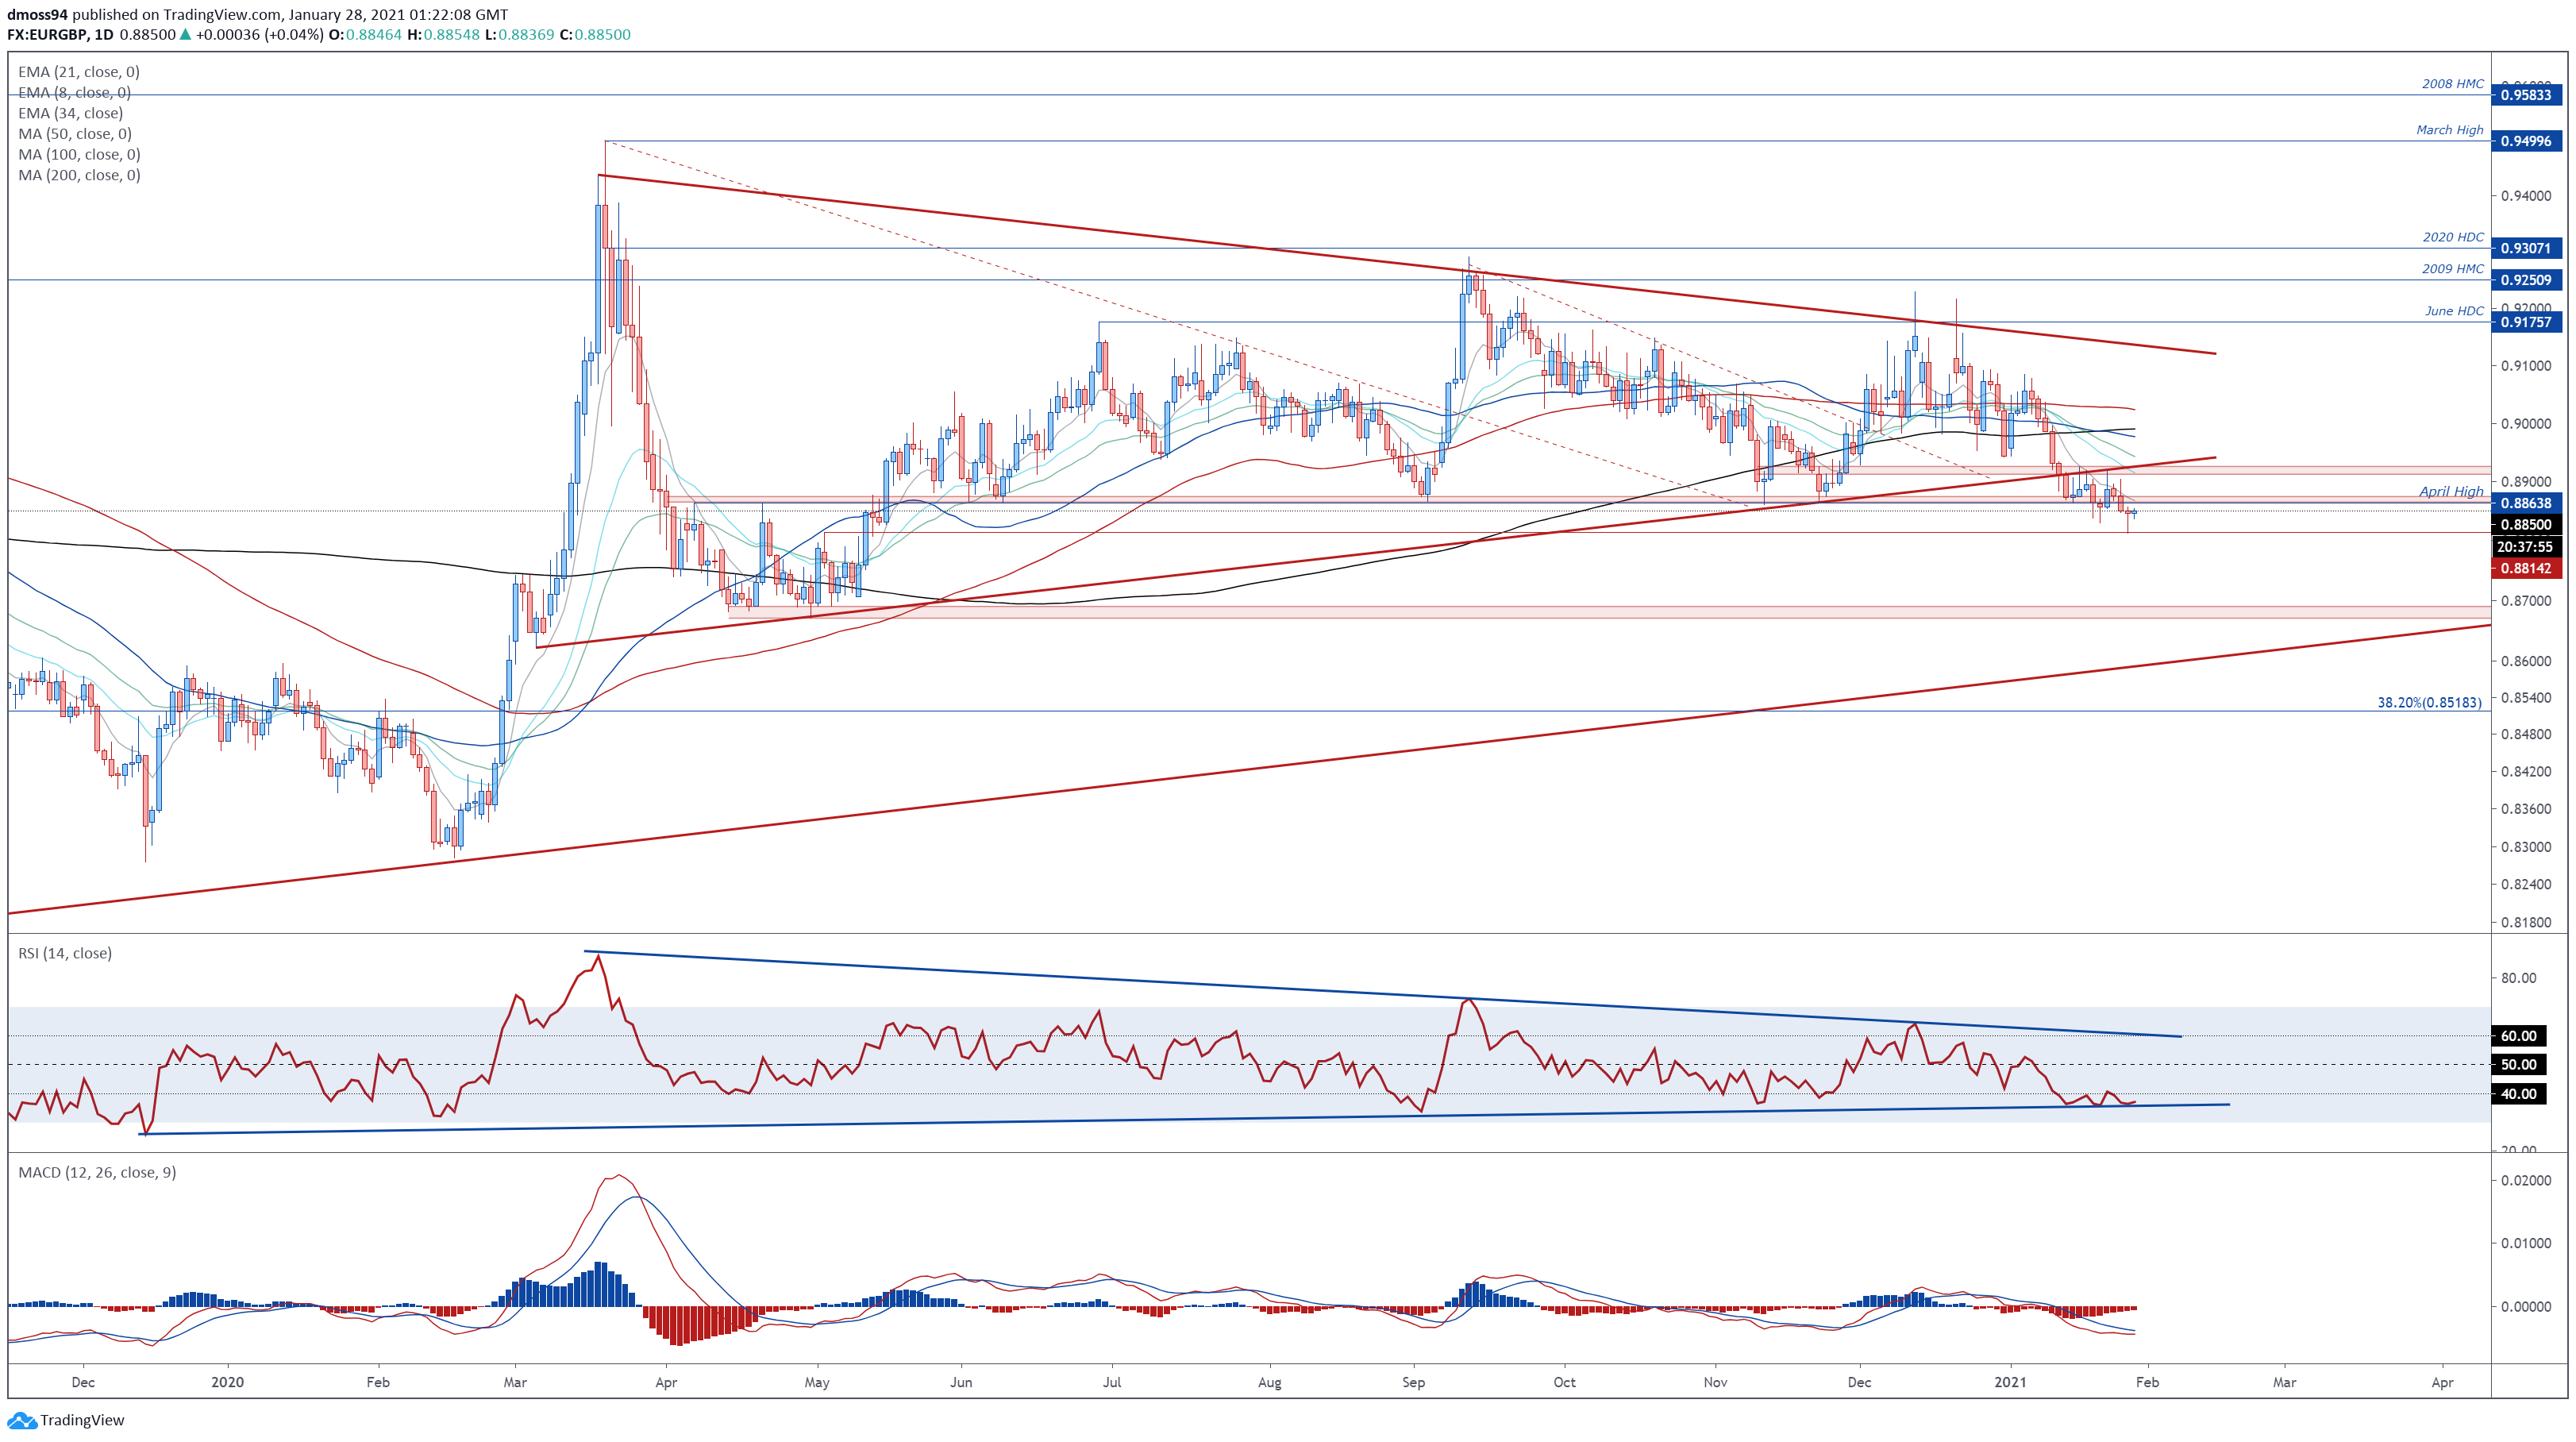
EUR/GBP daily chart created using Tradingview
After collapsing through Symmetrical Triangle support and the April 2020 high (0.8864), EUR/GBP’s longer-term technical outlook seems skewed to the downside.
However, the formation of a bullish Hammer candle just above psychological support at 0.8000, combined with the RSI continuing to respect the uptrend extending from the December 2019 extremes, suggests that the exchange rate could gain ground in the coming days.
Pushing back above the 8-EMA (0.8868) could generate a push to retest range resistance at 0.8913 – 0.8926, with a convincing break above opening the door for buyers to challenge the 200-MA (0.8990).
That being said, if 0.8880 successfully stifles buying pressure, a retest of the monthly low (0.8812) seems relatively likely. Clearing that would probably signal the resumption of the primary uptrend and carve a path to probe range support at 0.8670 – 0.8690.
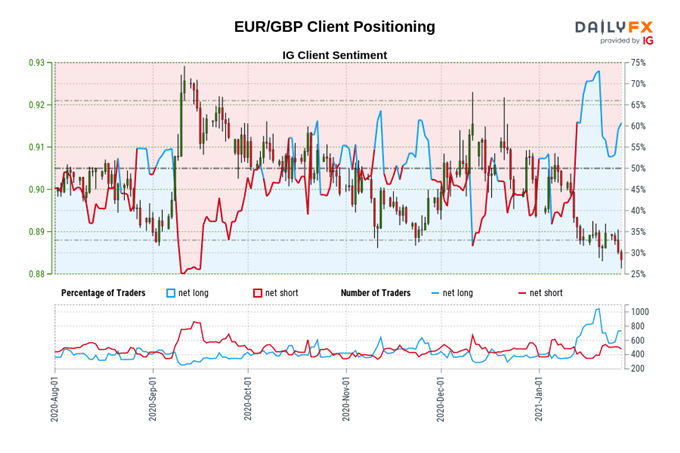
The IG Client Sentiment Report shows 58.80% of traders are net-long with the ratio of traders long to short at 1.43 to 1. The number of traders net-long is 5.46% lower than yesterday and 4.39% lower from last week, while the number of traders net-short is 1.66% lower than yesterday and 3.47% lower from last week.
We typically take a contrarian view to crowd sentiment, and the fact traders are net-long suggests EUR/GBP prices may continue to fall.
Yet traders are less net-long than yesterday and compared with last week. Recent changes in sentiment warn that the current EUR/GBP price trend may soon reverse higher despite the fact traders remain net-long.
-- Written by Daniel Moss, Analyst for DailyFX
Follow me on Twitter @DanielGMoss


