


EUR/USD Price Technical Forecast
- Bullish signals on EUR/USD chart
- Stronger bulls above 1.1118
EUR/USD- Reverses Course
Last week, Euro recovered some losses against US Dollar and rallied on Friday to 1.1053 – its highest level in over three weeks, as some bears seemed to ease up further. The market closed the weekly candlestick in the green with 1.6% gain.
Alongside that, the Relative Strength Index (RSI) crossed above 50 highlighting the end of downtrend momentum and a possible start of uptrend move.
EUR/USD Daily PRice CHART (JULY 1, 2018 – March 2, 2020) Zoomed Out


EUR/USD Daily Price CHART (Sep 25 – March 2, 2020) Zoomed in
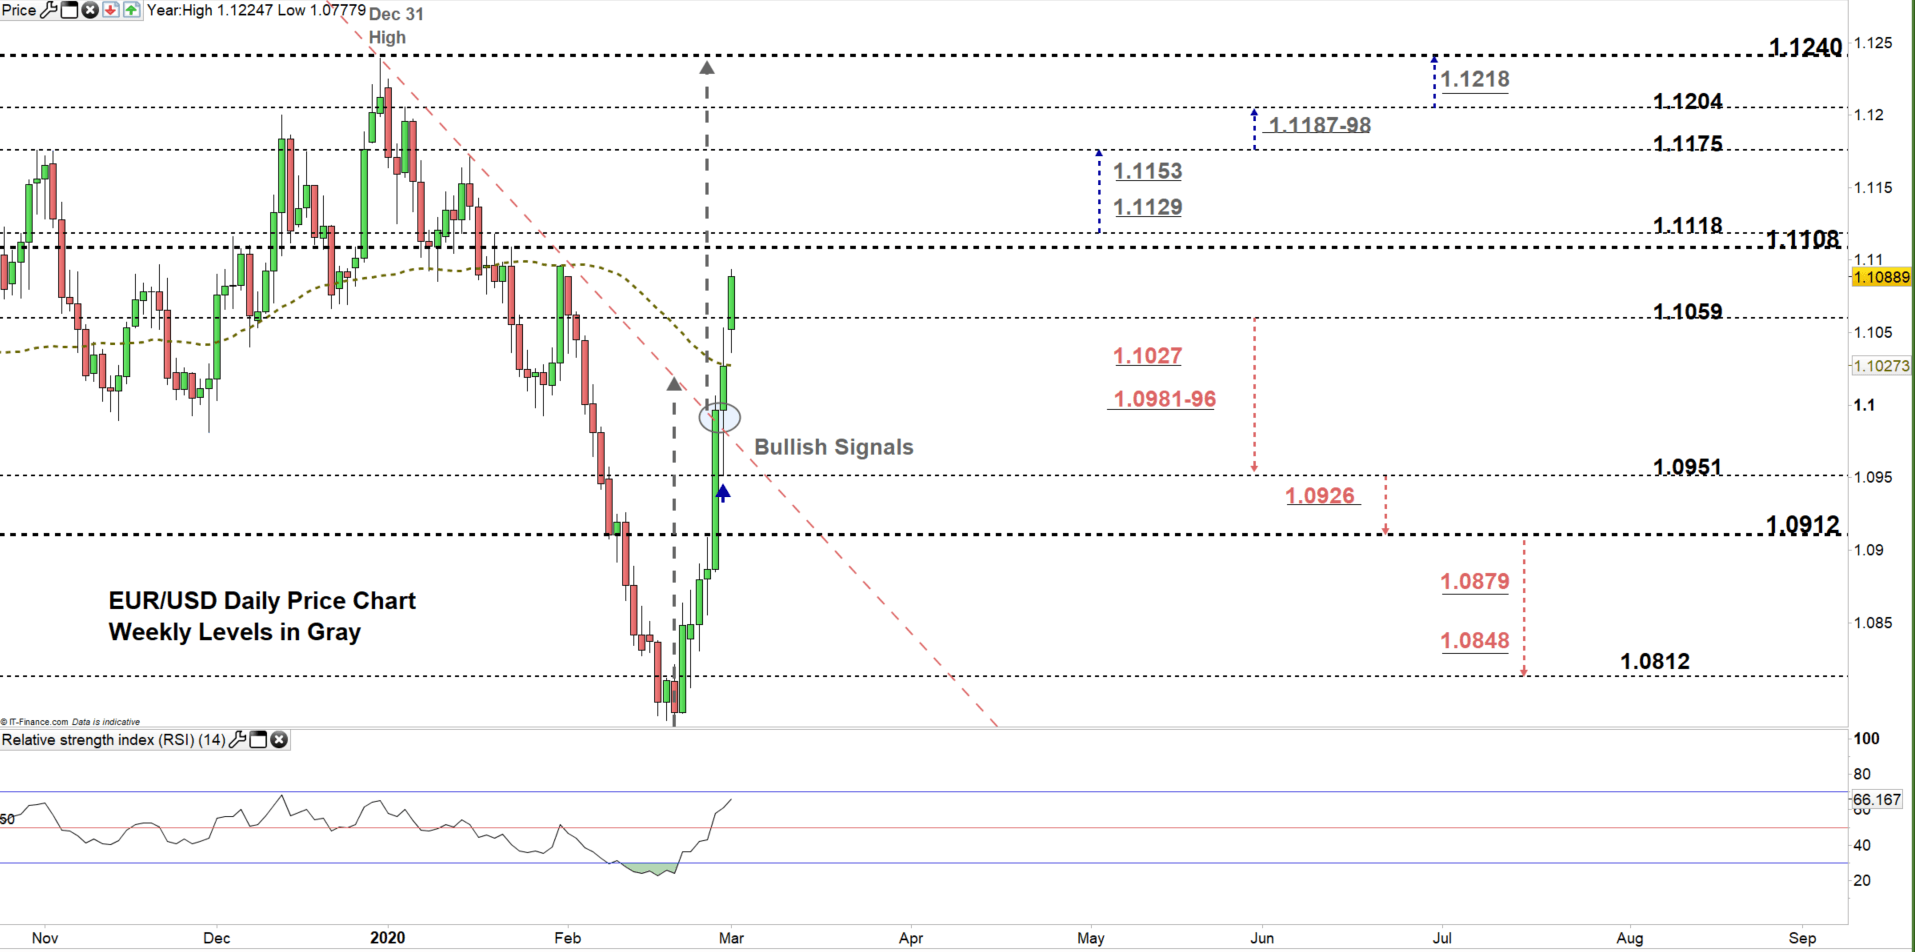
Looking at the daily chart, we notice that on Feb 20, bears led EURUSD to its lowest level in over two and half years at 1.0777. Later, the market corrected higher as discussed in our previous article . On Thursday, the price broke above the downtrend line originated from the Dec 31 high at 1.1239 eyeing a test of this high. On Friday, the pair rebounded from the higher end of current trading zone 1.0951 – 1.1059 and generated anther bullish signal
A close above 1.1118 could embolden bulls to lead EURUSD towards 1.1175. Further close above that level opens the door to more bullishness towards 1.1200 handle. That said, special attention should be paid to the weekly resistance levels and area underscored on the chart (zoomed in) as some traders may exit/ join the market around these points.
In turn, any failure in closing above the high end of the zone reflects market’s indecision at this stage. This could inspire bears to attempt pressing towards the low end of the zone. Further close below that level may encourage them to press for a test of 1.0912. Nevertheless, the daily support levels marked on the chart would be worth monitoring.

EUR/USD four Hour Price CHART (Jan 29 – March 2, 2020)

From the four-hour chart, we noticed that this week EUR/USD opened with a gap to the upside indicating that last week’s rally has not ended yet . Currently, the market eyes a test of the high end of the trading zone discussed above on the daily chart.
A break above 1.1129 could cause a rally towards 1.1172. Yet, the weekly resistance level underlined on the chart should be considered. On the other hand, a break below 1.1039 may send EURUSD towards 1.0996. Although, the daily support level marked on the chart should be watched closely.
See the chart to know more about key technical levels in a further bullish/bearish scenario.
Written By: Mahmoud Alkudsi
Please feel free to contact me on Twitter: @Malkudsi


