


EUR/USD Price Technical Forecast
- EUR/USD chart signals bear’s hesitation
- Weaker bears above 1.0912
EUR/USD- Bears Ease Up
On Thursday, Euro weakened further against US Dollar and printed its lowest level in over two and half years at 1.0777. The following day, the price rallied as bears showed more sway, then closed the weekly candlestick with a bullish Doji pattern, highlighting the market’s hesitation at this stage.
The Relative Strength Index (RSI) abandoned oversold territory signaling weaker downtrend momentum.
EUR/USD Daily PRice CHART (JULY 1, 2018 – FEB 24, 2020) Zoomed Out
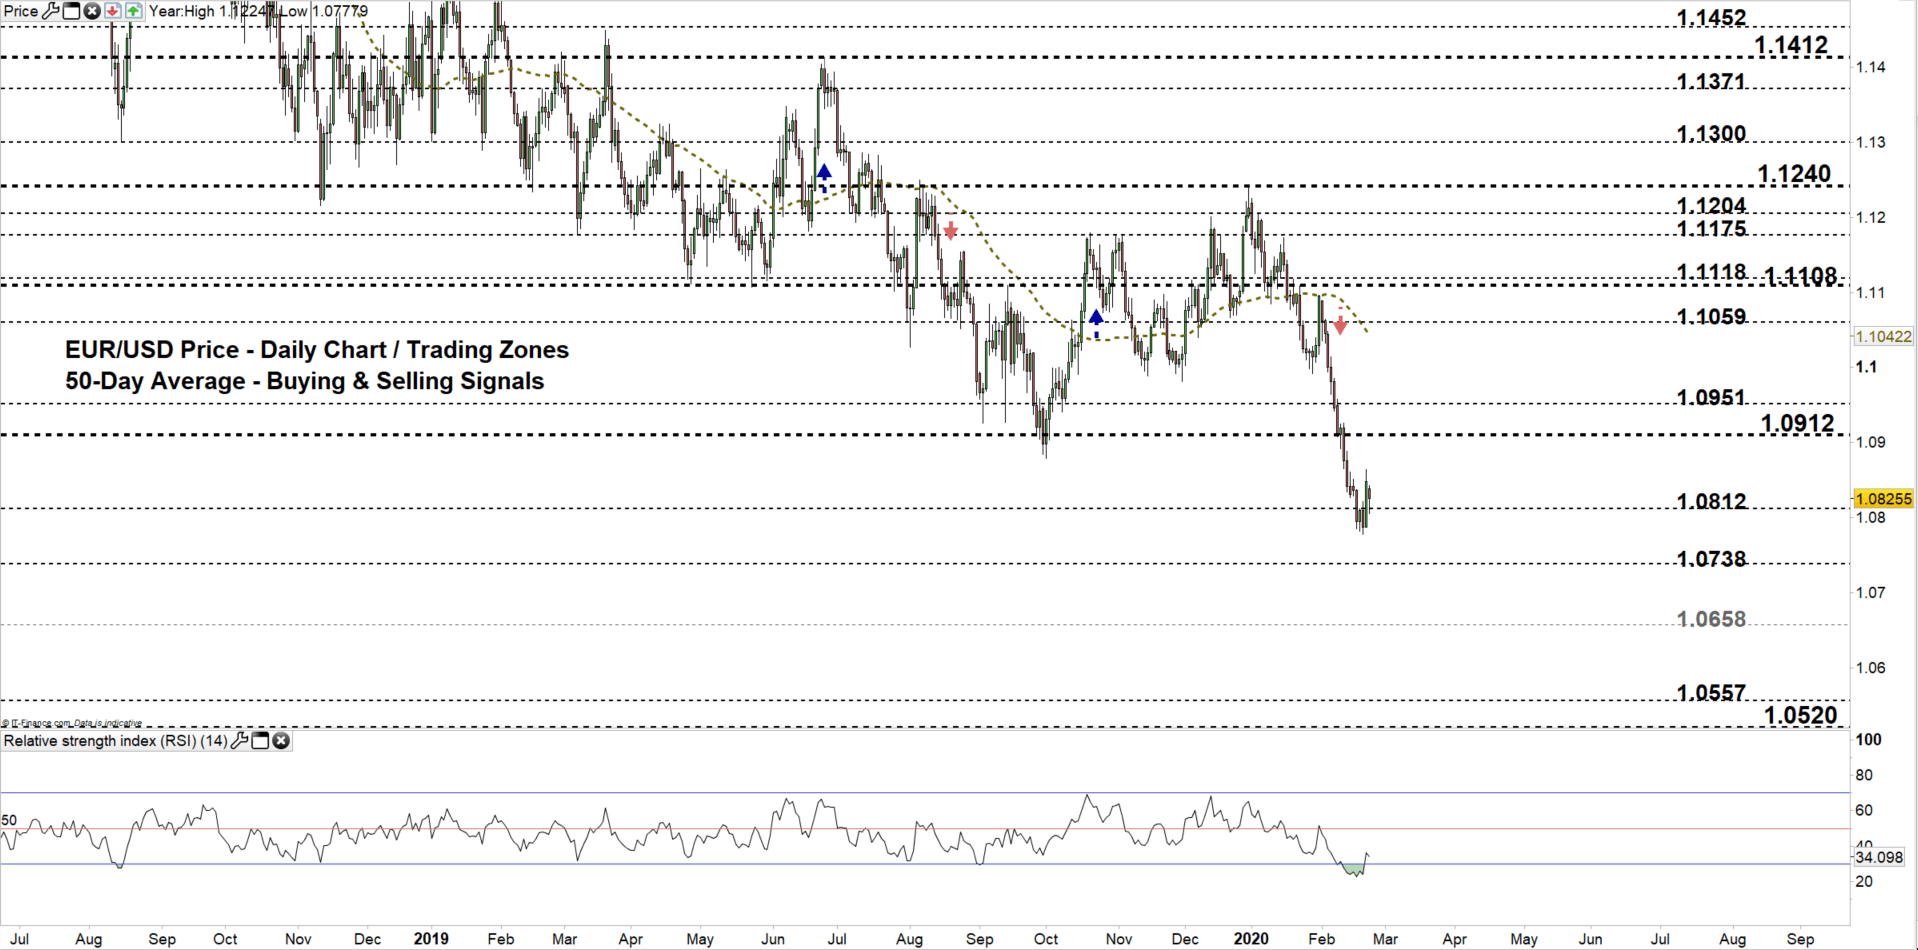

EUR/USD Daily Price CHART (Sep 25 – FEB 24, 2020) Zoomed in

Looking at the daily chart, we notice that since early February bears took charge and pressed EUR/USD from a trading zone to another. On Friday, the pair rallied to a higher trading zone 1.0812 – 1.0912.
This reflects bears’ reluctance and may lead more to pull back of the market, causing a rally towards the high end of the zone. Further close above this level opens the door for EURUSD to correct higher towards 1.0951. Yet, the weekly resistance levels underlined on the chart (zoomed in) should be monitored closely.
On the flip-side, a close below the low end of the zone indicates EURUSD bears may come back and press towards 1.0738. Further close below that level could cause more bearishness towards 1.0658. In that scenario, special attention should be paid to the daily and weekly support levels marked on the chart as some traders could exit/join the market around these points.

EUR/USD four Hour Price CHART (Jan 29 – FEB 24, 2020)
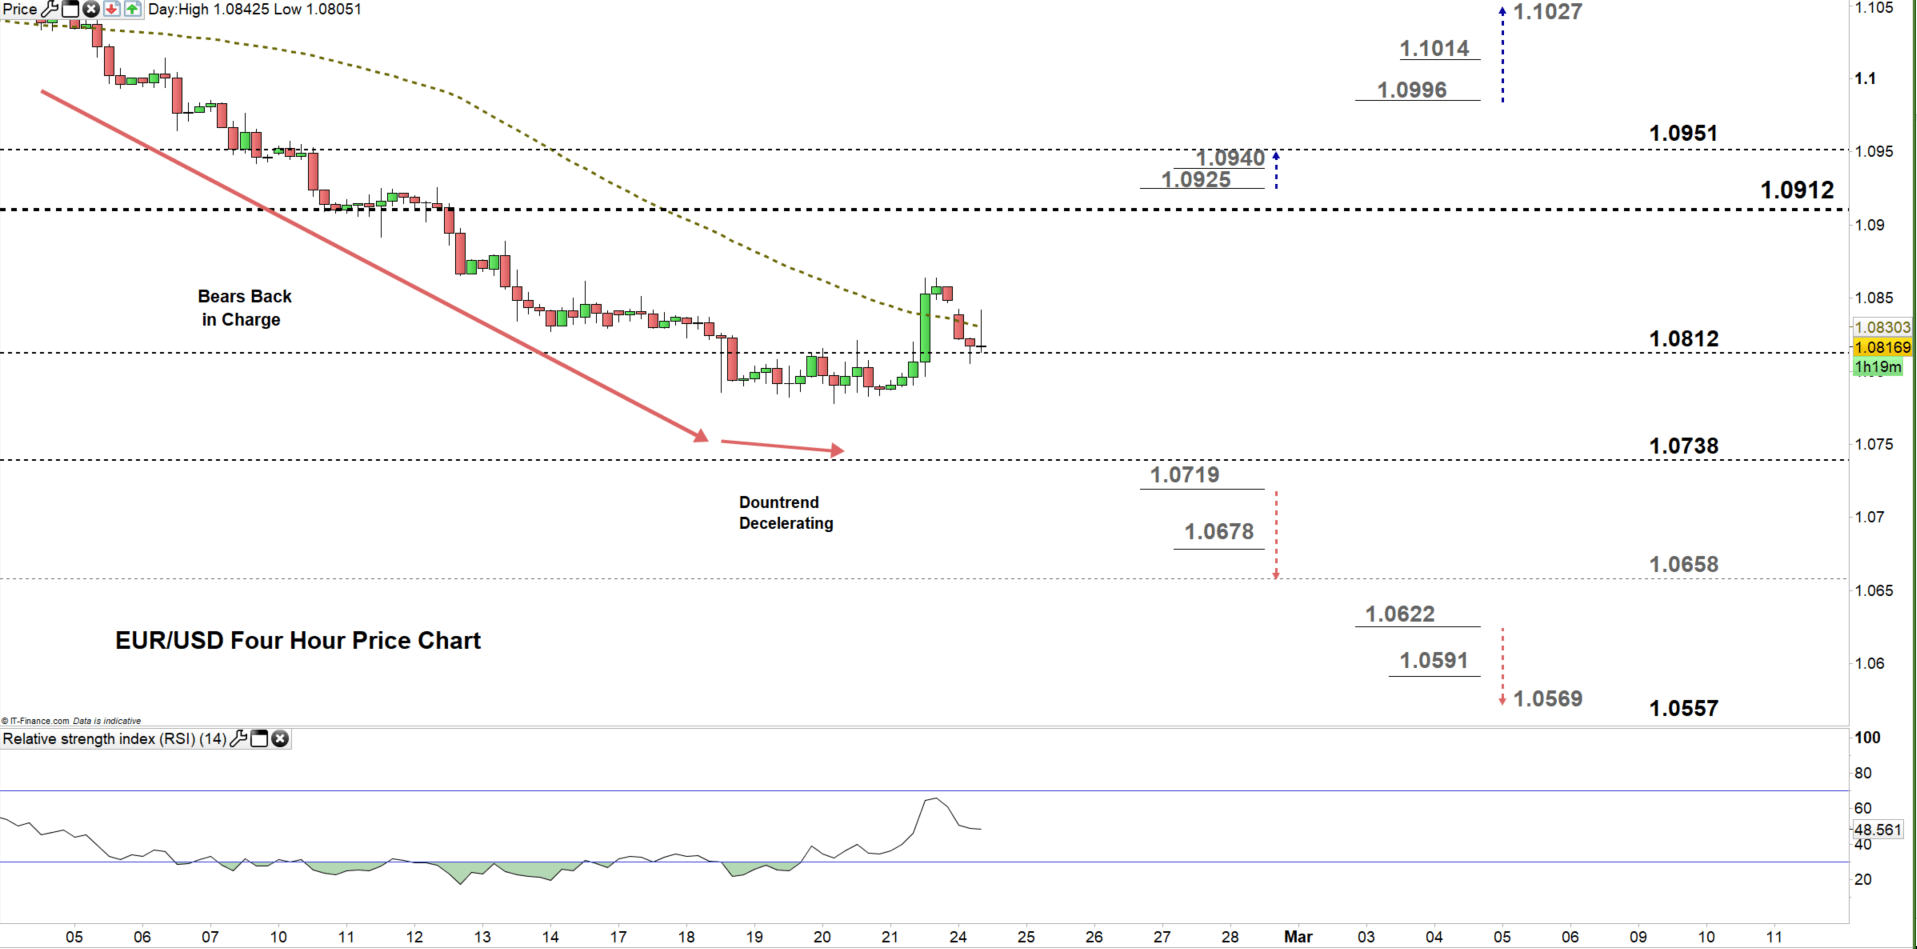
From the four-hour chart, we noticed that last week downtrend move decelerated then the price rallied as some bears seemed to cover.
Thus, a break above 1.0925 might lead the price to rally towards 1.0951. Although, the resistance level printed on the chart should be watched closely. In turn, a break below 1.0719 could send EUR/USD towards 1.0658. Yet, the weekly support level underlined on the chart should be kept in focus
See the chart to know more about key technical levels in a further bullish/bearish scenario.
Written By: Mahmoud Alkudsi
Please feel free to contact me on Twitter: @Malkudsi


