


EUR/USD Technical Forecast
See Our latest trading guides for free and discover what is likely to move the markets through Q4 of this year.
EUR/USD – Sideways pattern
On Tuesday, EUR/USD generated the signals discussed in our last update that triggered correction. On the following day, the price created a higher high at 1.1116. The pair has been trading in a trendless move since then See the chart (zoomed out).
Last week, the Relative Strength Index (RSI) Dropped from 58 to 51 then remained flat, highlighting weak buyers and weaker sellers.
Having trouble with your trading strategy? Need a hand? Here’s the #1 Mistake That Traders Make
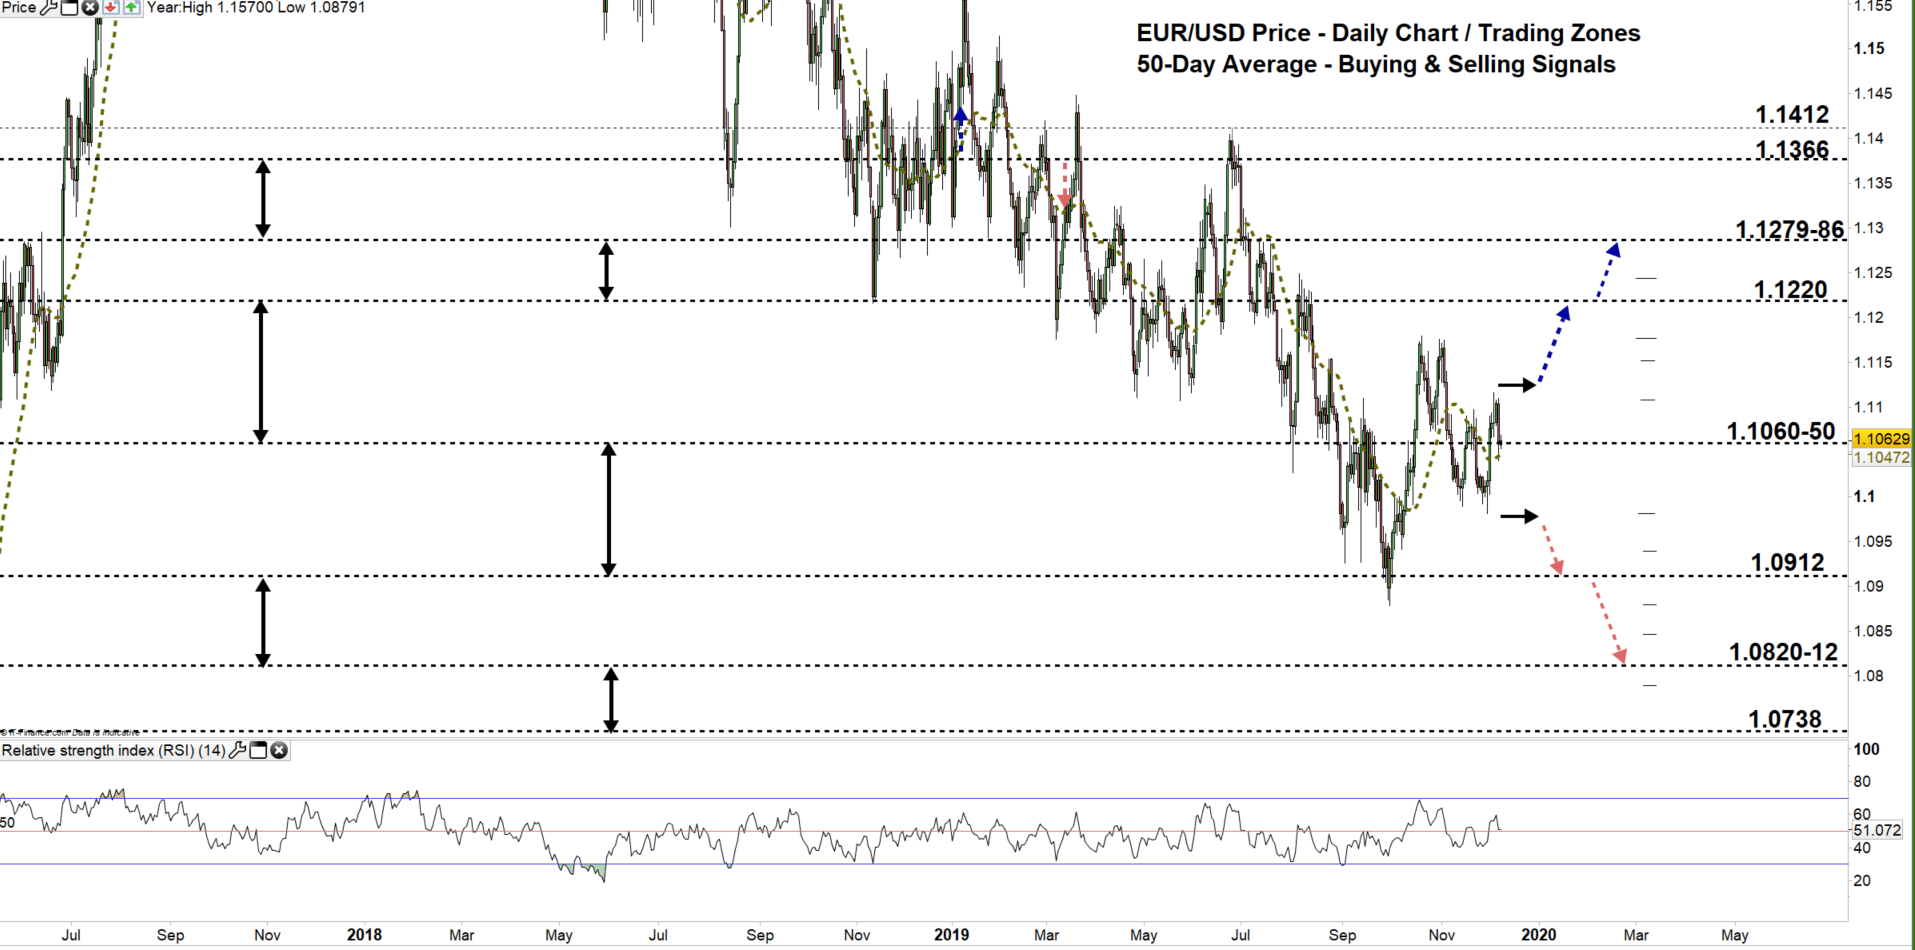
EUR/USD Daily PRice CHART (Mar 31, 2017 – DEC 9, 2019) Zoomed Out
EUR/USD Daily Price CHART (July 25 – DEC 9, 2019) Zoomed in

Looking at the daily chart, we notice on Friday the pair’s sellers pressed EUR/USD below the 50-Day average. However, the price rallied after and remained in current trading zone 1.1050- 1.1220 as some sellers took profit.
Hence, a successful close below the low end of the zone could embolden sellers to lead EURUSD towards 1.0912. Although, the weekly support levels underlined on the chart (zoomed in) would offer attractive exit points for some sellers.
That said, a close above the low end of the zone could mean more of the same i.e. more of the sideways move. A close above the high end of the zone could be a clear signal for buyers to take charge and push EUR/USD towards the vicinity of 1.1279-86. In that scenario, the weekly resistance level and areas marked on the chart should be kept in focus.
Just getting started? See our Beginners’ Guide for FX traders
EUR/USD four Hour Price CHART (SEp 24 – DEC 9, 2019)
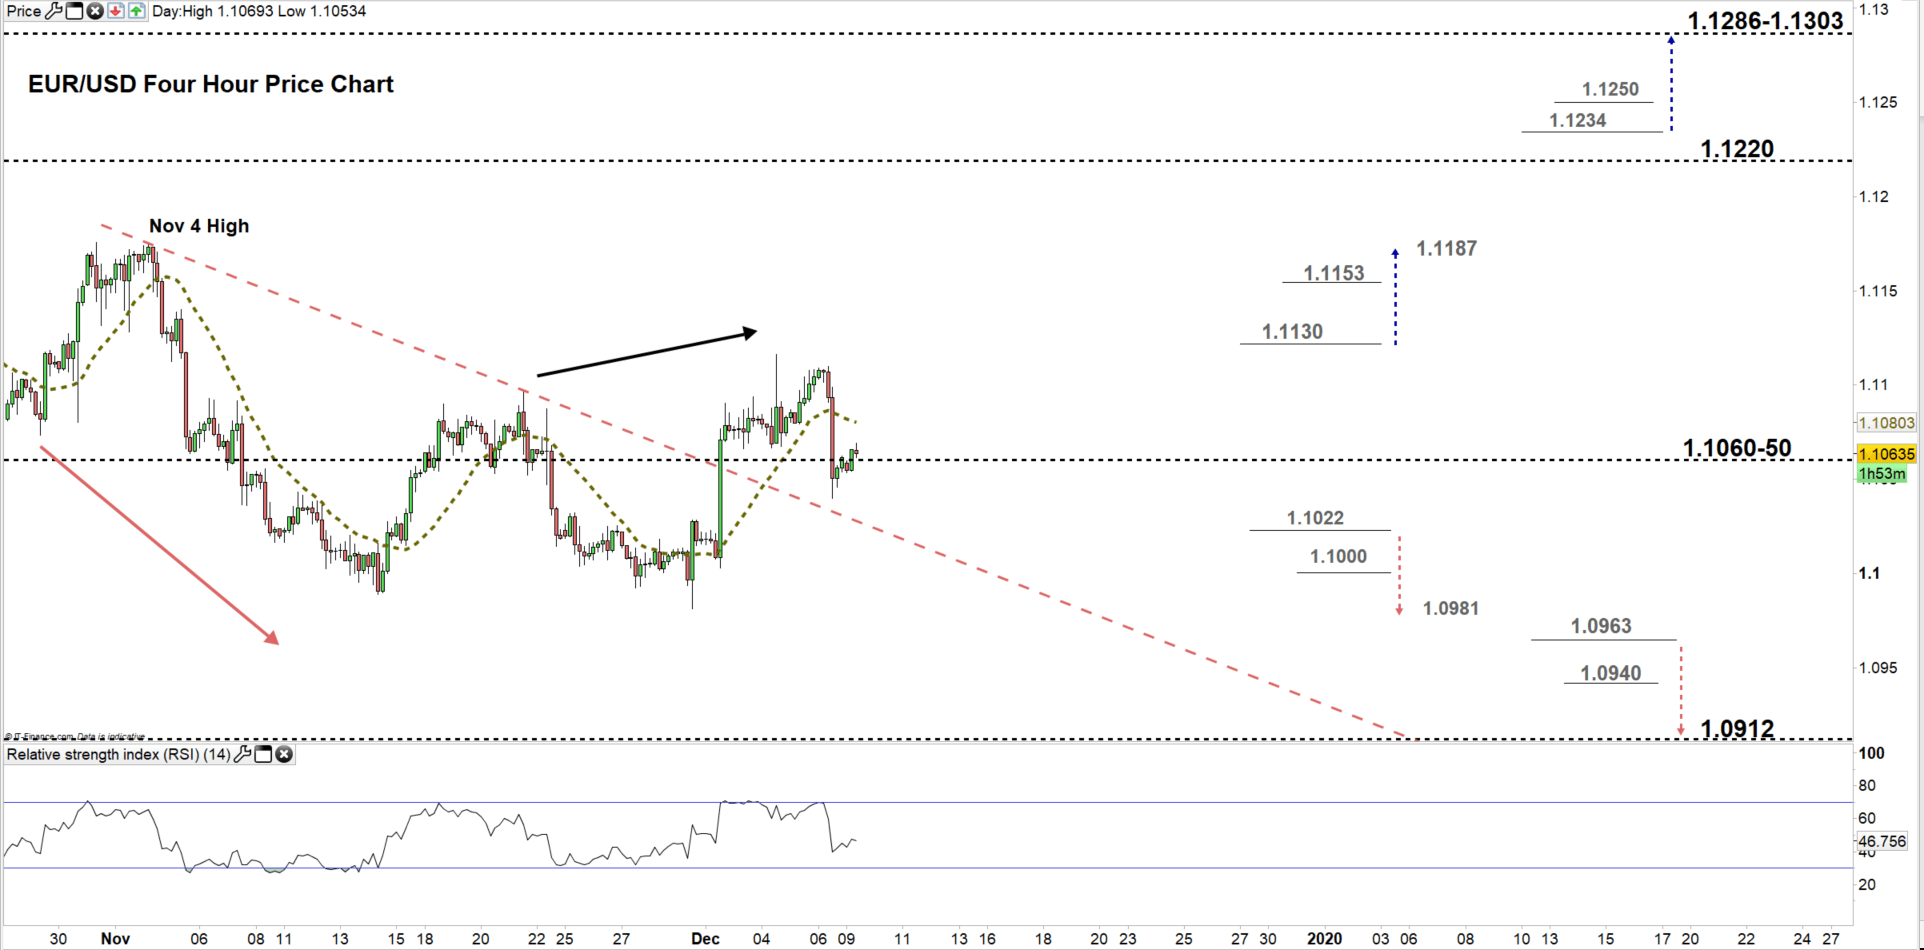
From the four-hour chart, we notice on Dec 2 EUR/USD broke above the downtrend line originated from the Nov 4 at 1.1175. A bearish signal could be produced if the price trades below this trendline.
Thus, a break below 1.1022 could send EURUSD towards the Nov 29 low at 1.0981. Nevertheless, the daily support level at 1.1000 handle should be considered. On the other hand, a break above 1.1130 could cause a rally towards 1.1187. Yet, the weekly resistance level underlined on the chart should be watched closely.
See the chart to know more about key levels the price would encounter in a further bullish/ bearish move.
Join Me on Friday, DEC 12 at 14:00 GMT. In this session we will talk about most Basic Concepts in Technical Analysis
Written By: Mahmoud Alkudsi
Please feel free to contact me on Twitter: @Malkudsi


