


EUR/USD Technical Analysis
See Our latest trading guides for free and discover what is likely to move the markets through Q4 of this year.
EUR/USD – Hesitant Sellers
On Friday, EUR/USD tumbled to 1.0981- its lowest level in over seven weeks. However, the price rallied after, then settled above 1.1000 handle. The weekly candlestick closed with a Doji pattern highlighting market’s indecision at this stage.
Last week, the Relative Strength Index (RSI) remained flat below 50, highlighting a paused bearish momentum.
Having trouble with your trading strategy? Need a hand? Here’s the #1 Mistake That Traders Make
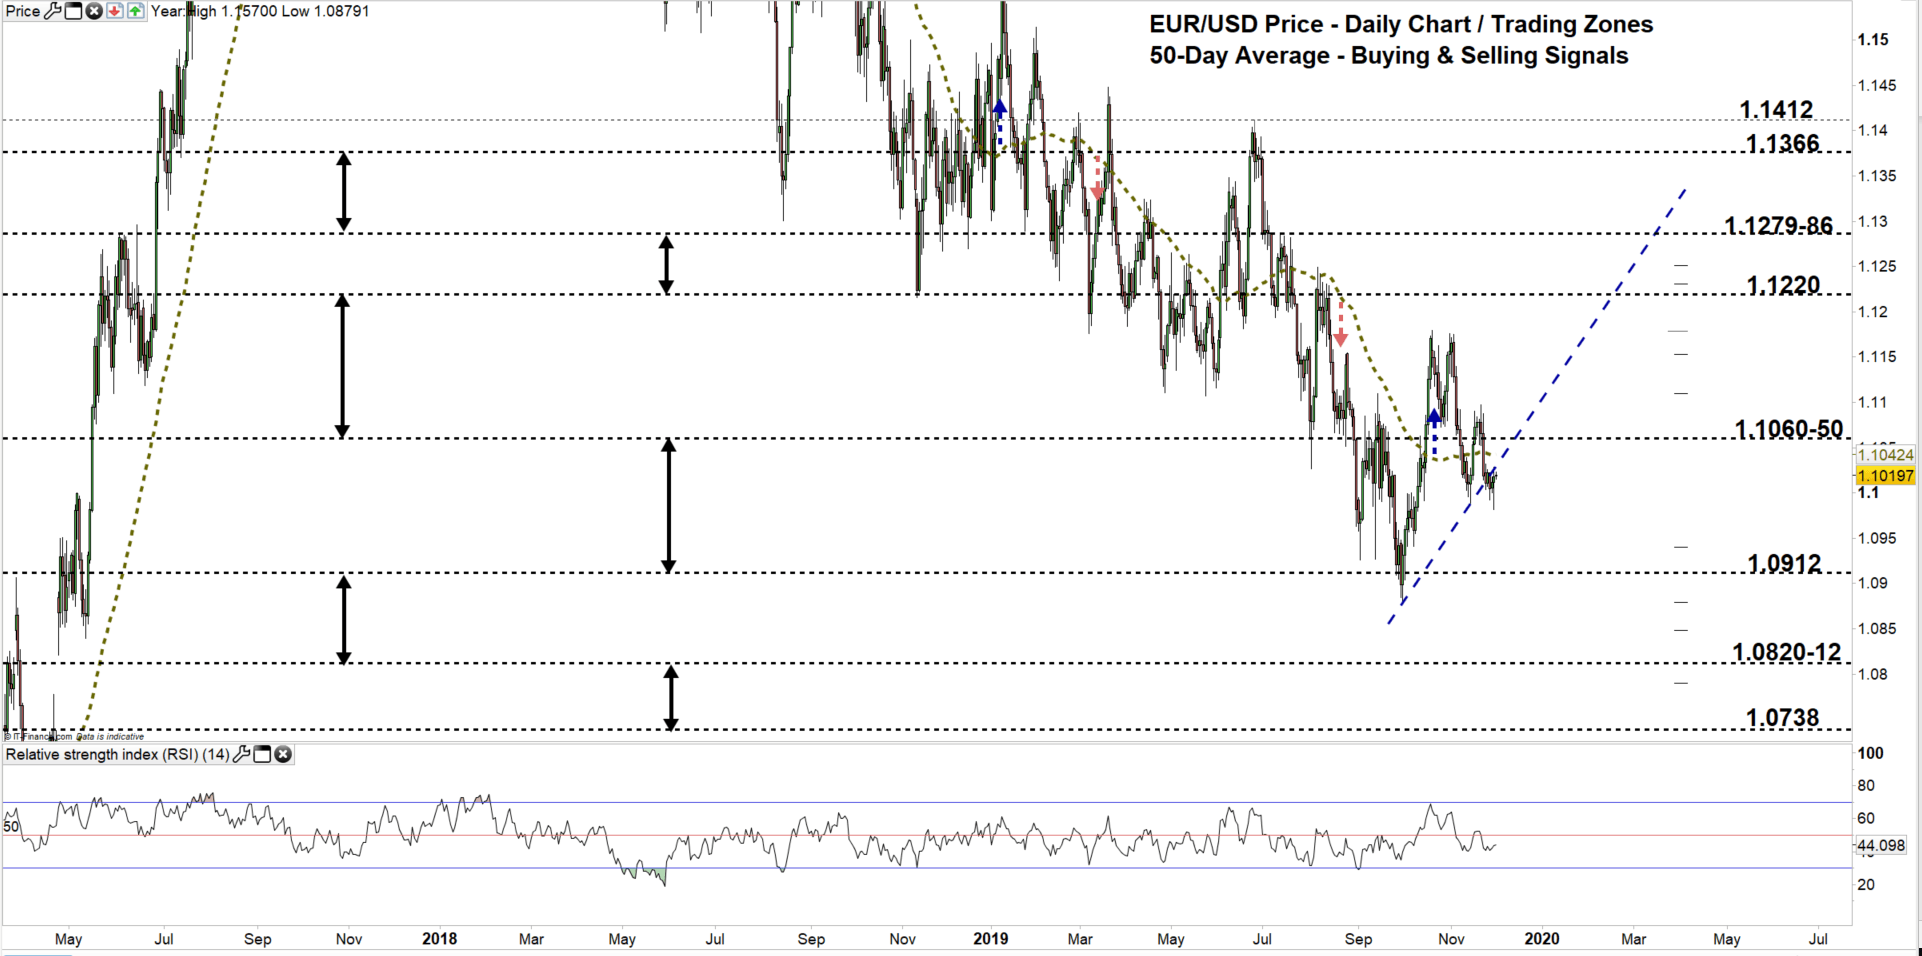
EUR/USD Daily PRice CHART (Mar 31, 2017 – DEC 2, 2019) Zoomed Out
EUR/USD Daily Price CHART (Aug 1 – DEC 2, 2019) Zoomed in
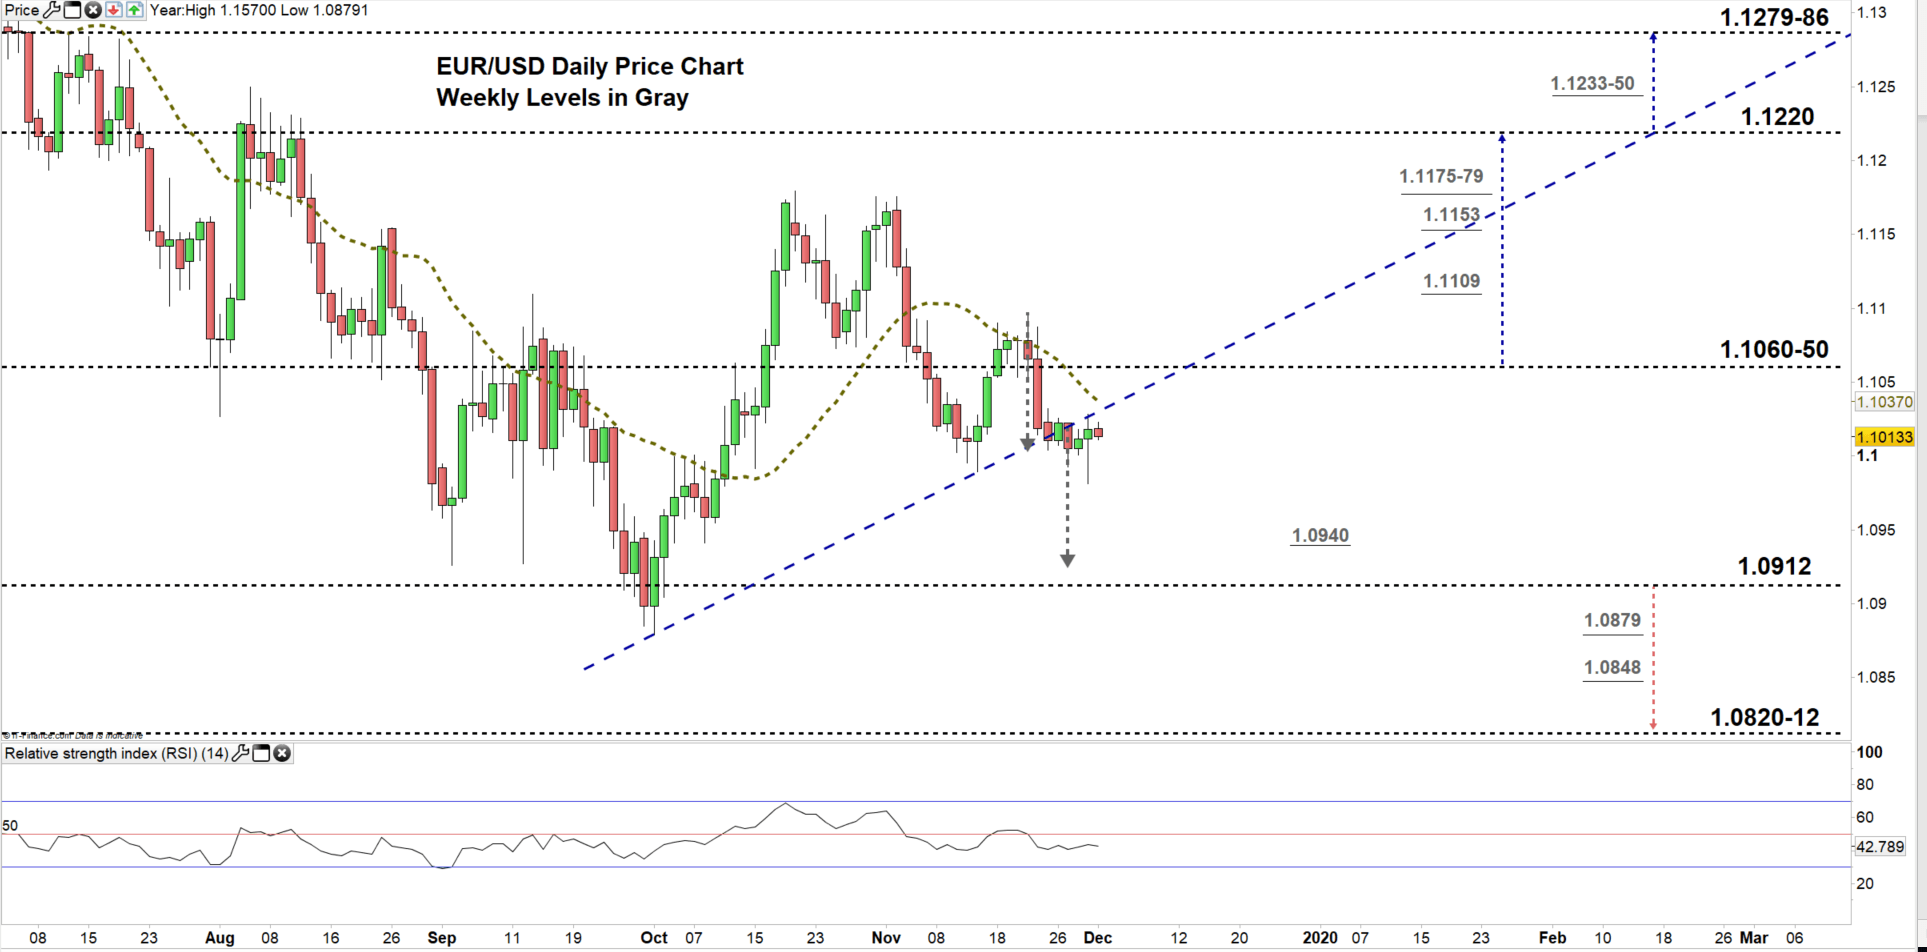
Looking at the daily chart, we notice on Nov 22 the pair declined to a lower trading zone 1.0912- 1.1050, then closed below the 50-day average. On the following day, EUR/USD broke below the uptrend line originated form the Oct 1 low at 1.0879, generating an additional bearish signal.
Therefore, the price may swing lower for a test of the low end of the zone. Further close below this level could send EURUSD towards the vicinity of 1.0820-12. Although, the downtrend momentum could weaken at the weekly support levels underscored on the chart (Zoomed in) as they would be potential points of take profit for some sellers.
That said, a close above 1.1060 could mean seller’s exit of the market. This opens the door for the pair to correct downtrend move, then look for a test of 1.1220. Nevertheless, the weekly resistance levels underlined on the chart should be monitored.
Just getting started? See our Beginners’ Guide for FX traders
EUR/USD four Hour Price CHART (SEp 27 – DEC 2, 2019)
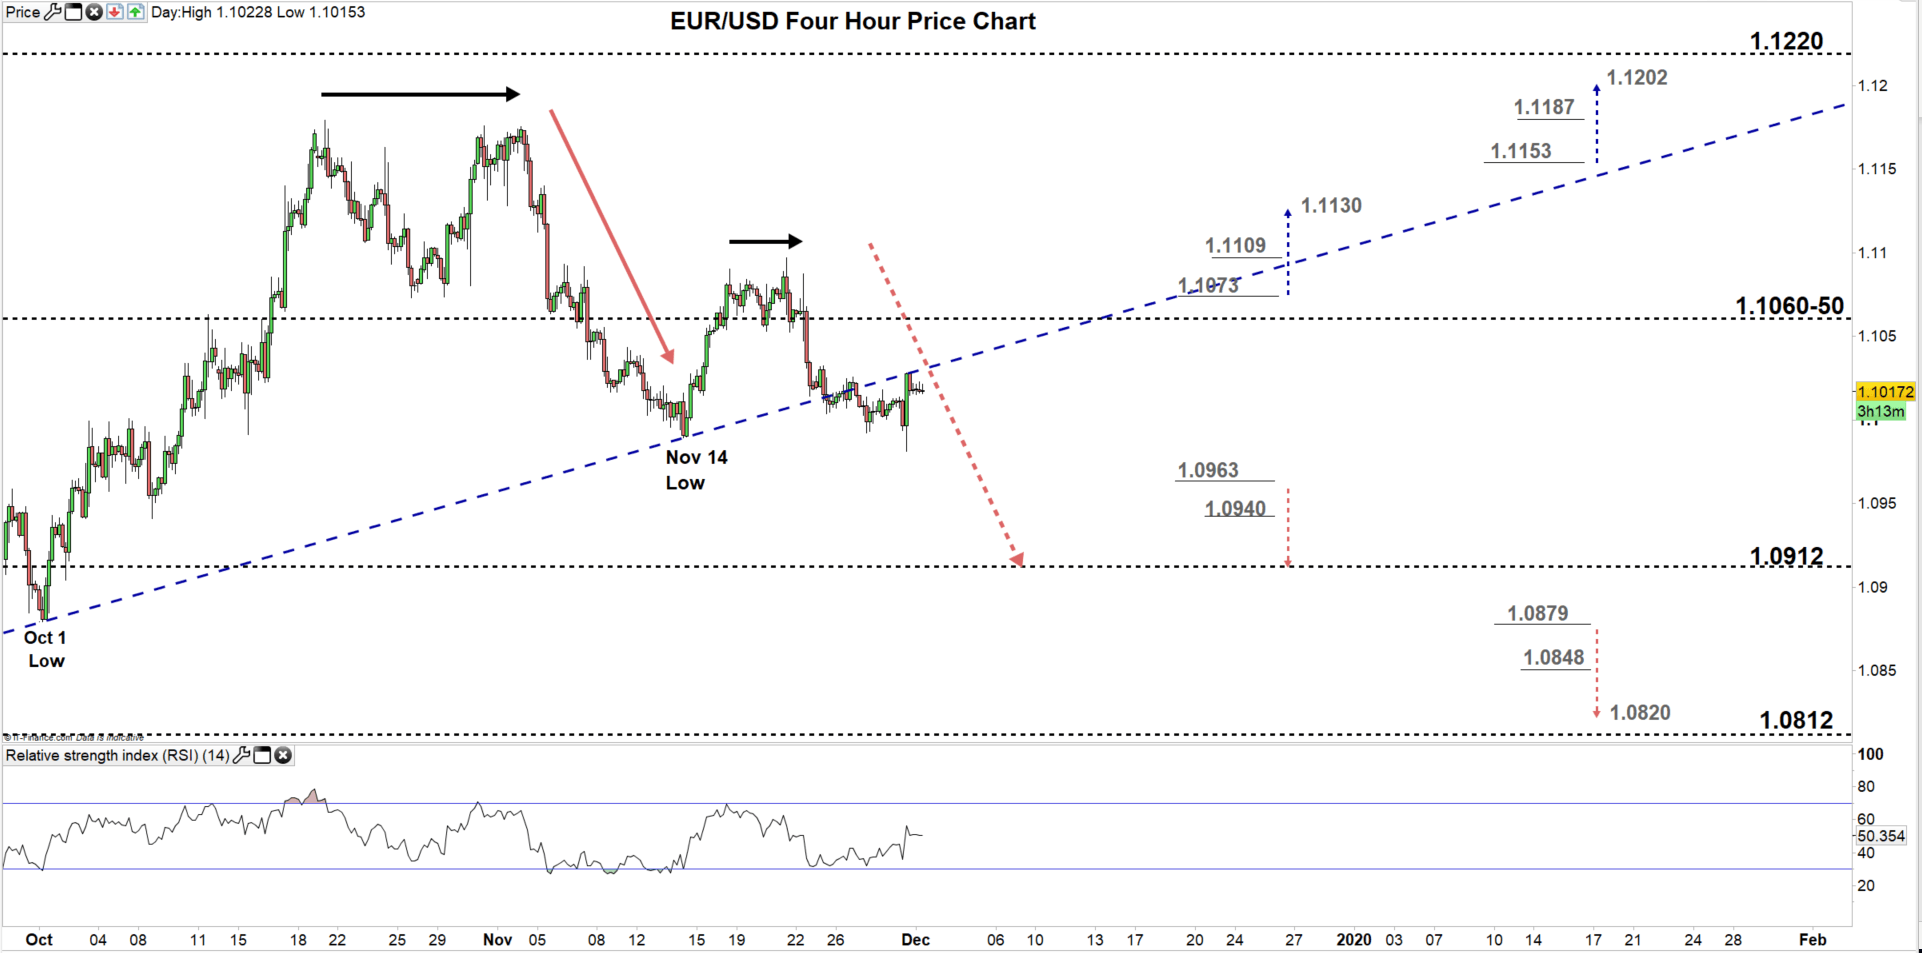
From the four-hour chart, we notice on Friday EURUSD rebounded from the uptrend line, reflecting that majority of sellers were still holding their positions.
Hence, a break below 1.0963 may convince more sellers to join the market and press towards the low end of current trading zone, discussed above on the daily chart. Yet, the weekly support level marked on the chart should be kept in focus. On the other hand, a break above 1.1073 could lead EURUSD to correct higher towards 1.1130. In that scenario, the weekly resistance level underscored on the chart needs to be considered.
See the chart to know more about key levels the price would encounter in a further bullish/ bearish move.
Join Me on Friday, DEC 6 at 14:00 GMT. In this session we will talk about most common directional and momentum indicators and how to use them
Written By: Mahmoud Alkudsi
Please feel free to contact me on Twitter: @Malkudsi


