


EUR/USD Talking Points:
- The Euro’s recent push higher still leaves it shy of a lasting reversal versus USD
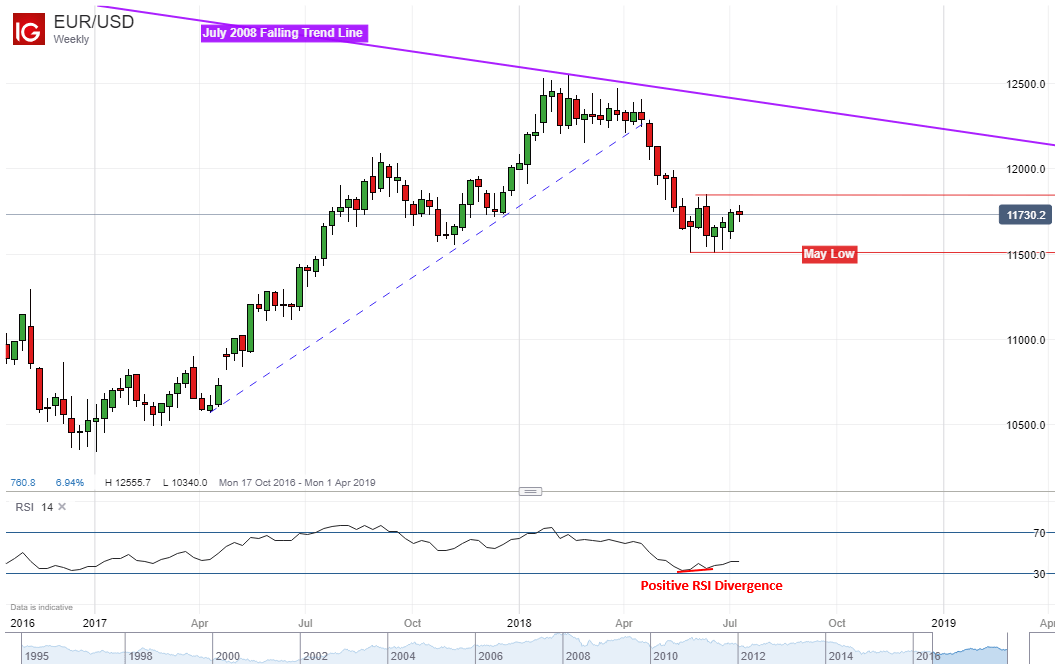
- A resistance channel is keeping EUR/USD at bay, focus turns to rising support
- If the pair falls, it faces the May low. A push higher eventually faces 1.2164
Find out what the Euro could face in the third quarter in our most recent forecast in the DailyFX Trading Guides page
Previously when we looked at EUR/USD, the pair was potentially heading for another test of the May low at 1.1509. Since then, the pair was unable to get there and we have had a third bounce around that support area. Looking at the weekly chart below, we can see the emergence of positive RSI divergence which warns that downside momentum is ebbing. We could be heading for 1.1852, the June 14 high, next.
Zooming in on the daily chart reveals that in addition to the weekly one, positive RSI divergence was also present heading into the most recent upside push. However, EUR/USD stopped short just of the daily closes achieved in early June around 1.1804. Combining this area with the June 14th high reveals a range of resistance that if broken, could mean more gains ahead.
Simultaneously, the pair is being supported by a near-term rising line dating back to the end of June (red line on chart below). Achieving a daily close above/below those important levels could reveal where EUR/USD heads next. A break below support exposes the 23.6% Fibonacci extension at 1.1639 before once again revealing the May low at 1.1509. Another pause on that could pave the way for a triple bottom.
On the other hand, a push above immediate resistance opens the door to test the 50% midpoint of the Fibonacci retracement at 1.1961 followed by the 61.8% level at 1.2068. Getting above the latter exposes 1.2164 which acted as key support during the first third of 2018. It may reestablish itself as new resistance next.
Just getting started trading the Euro? See our beginners’ guide for FX traders to learn how you can apply this in your strategy!

EUR/USD Trading Resources:
- Join a free Q&A webinar and have your trading questions answered
- Having trouble with your strategy? Here’s the #1 mistake that traders make
- See how the Euro is viewed by the trading community at the DailyFX Sentiment Page
--- Written by Daniel Dubrovsky, Junior Currency Analyst for DailyFX.com
To contact Daniel, use the comments section below or @ddubrovskyFX on Twitter


