


EUR/GBP Technical Analysis
EUR/GBP Price – Multi-Week High
On Friday, EUR/GBP took off to a near three-month high at 0.9072 then closed the weekly candlestick in the green with a 0.8% gain.
The EU-UK negotiations continue to be one of the market movers. This week, the EU chief Brexit negotiator Barnier stated that: “The ball is in the UK’s court ” and added that the UK would be more affected than the EU if trade tariffs kick in, meaning that Europe would not cut a deal at any cost.
EUR/GBP DAILY PRICE CHART (Aug 1, 2018 – June 26, 2020) Zoomed Out
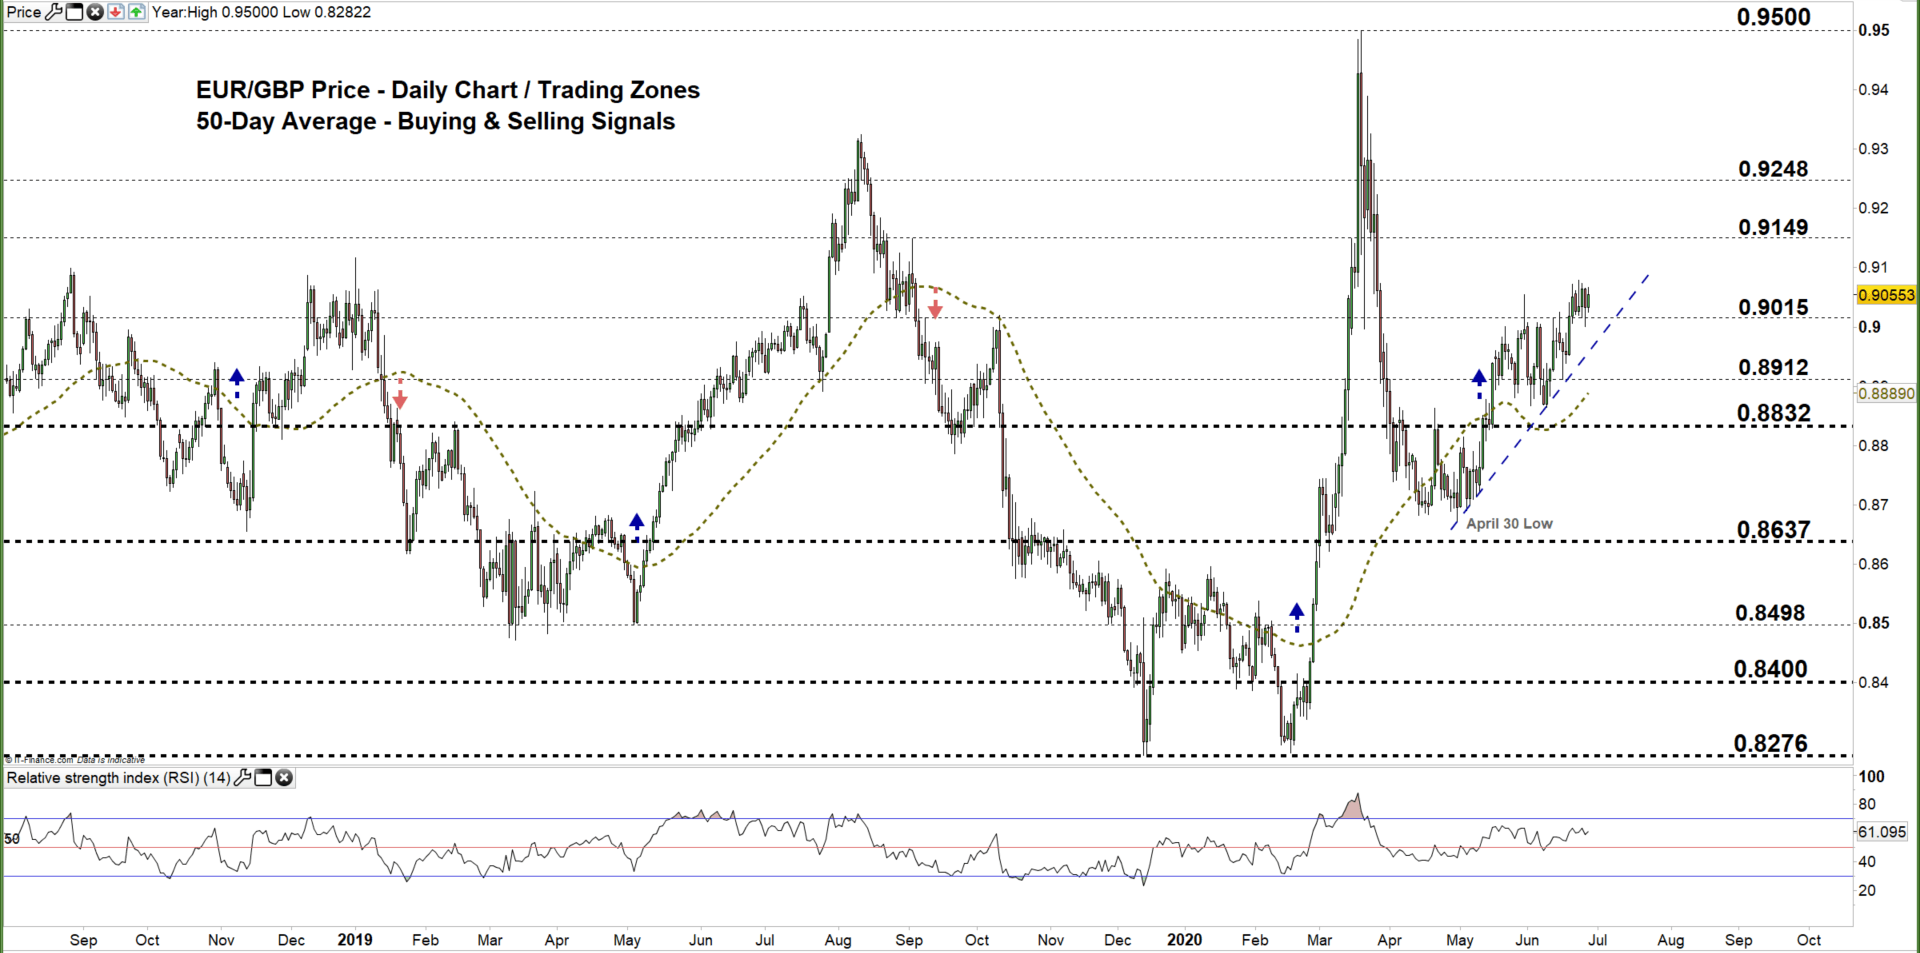

EUR/GBP DAILY PRICE CHART (May 13 – June 26, 2020) Zoomed In

On June 18, EUR/GBP broke above the downtrend line originated from the May 29 high at 0.9054, and generated a bullish signal. Yesterday, the price rebounded from the aforementioned line then climbed back to the current trading zone 0.9015 – 0.9149 highlighting that bullish bias was still intact.
Another close above the low end of the zone signals that bulls may push towards the high end of it. A further close above that level could encourage bulls to extend the rally towards 0.9248.
On the other hand, a close below the low end reflects the bull’s hesitation and this could send EURGBP towards 0.8912. Any further close below that level may send the market even lower towards 0.8832.

EUR/GBP FOUR HOUR PRICE CHART (June 6 – June 26, 2020)
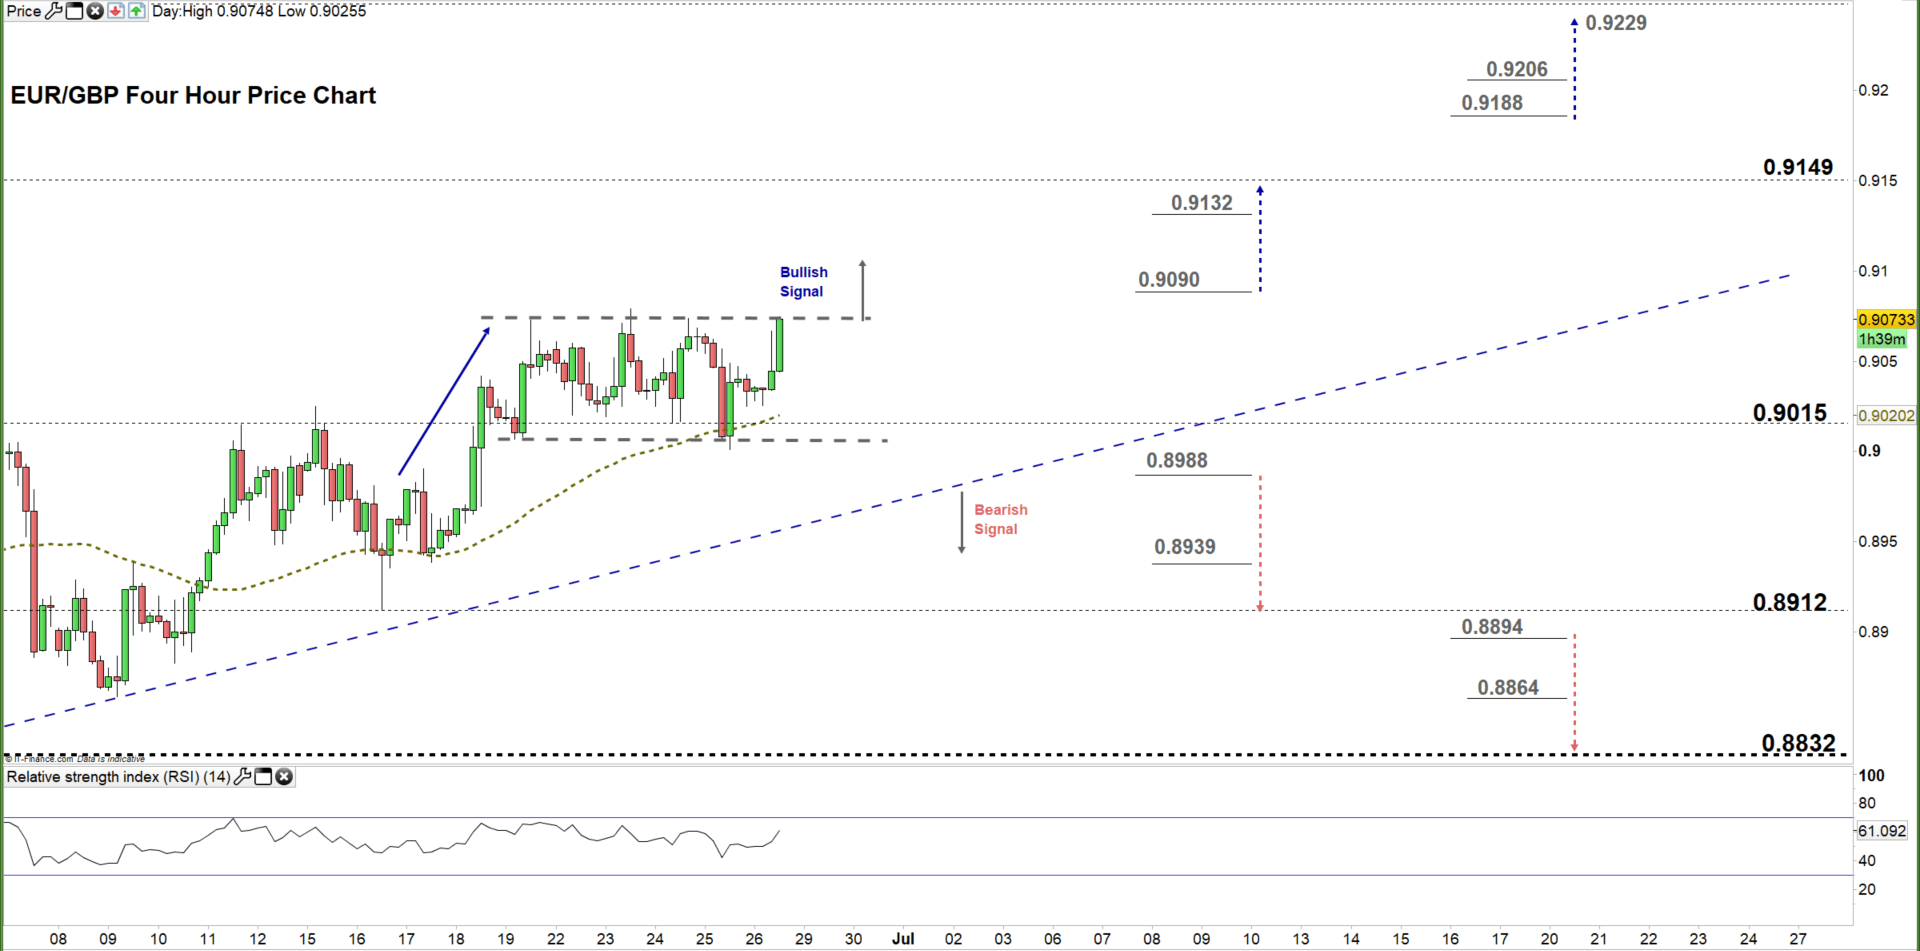
On Monday, EURGBP corrected its upward trend and started a sideways move creating lower highs with higher lows. Therefore, a break above the higher line of the bullish rectangle would be considered a bullish signal, while any violation of the uptrend line originated from the April 30 low would be considered a bearish signal.
To conclude, a break below 0.8988 could send EURGBP towards 0.8912 while, any break in above 0.9090 may trigger a rally towards the high end of the current trading zone discussed above on the daily chart. That said, the weekly support and resistance levels marked on the four-hour chart should be watched closely.

Written By: Mahmoud Alkudsi, Market Analyst
Please feel free to contact me on Twitter: @Malkudsi


