


EUR/GBP Technical Analysis
- EUR/GBP declined after rising support line fell apart
- Fading downside momentum may precede a reversal
- Friday’s performance may set trajectory for next week
Just started trading EUR/GBP? Check out our beginners’ FX markets guide !
EUR/GBP aimed lower over the past few days after a near-term rising support line from the end of January broke. Progress to the downside was cushioned by a range of support between 0.86983 and 0.86683 as anticipated. This is a critical barrier that has had an impact on the pair on multiple occasions over the past eleven months or so.
Will the British Pound be able to resume gains against the Euro in the days ahead, continuing the dominant trend from earlier in January? While progress can be made lower, keep a close eye on RSI on the daily chart. If prices reach the January lows and surpass them, positive RSI divergence could form. This would indicate fading downside momentum and could precede a reversal to the upside.
EUR/GBP Daily Chart

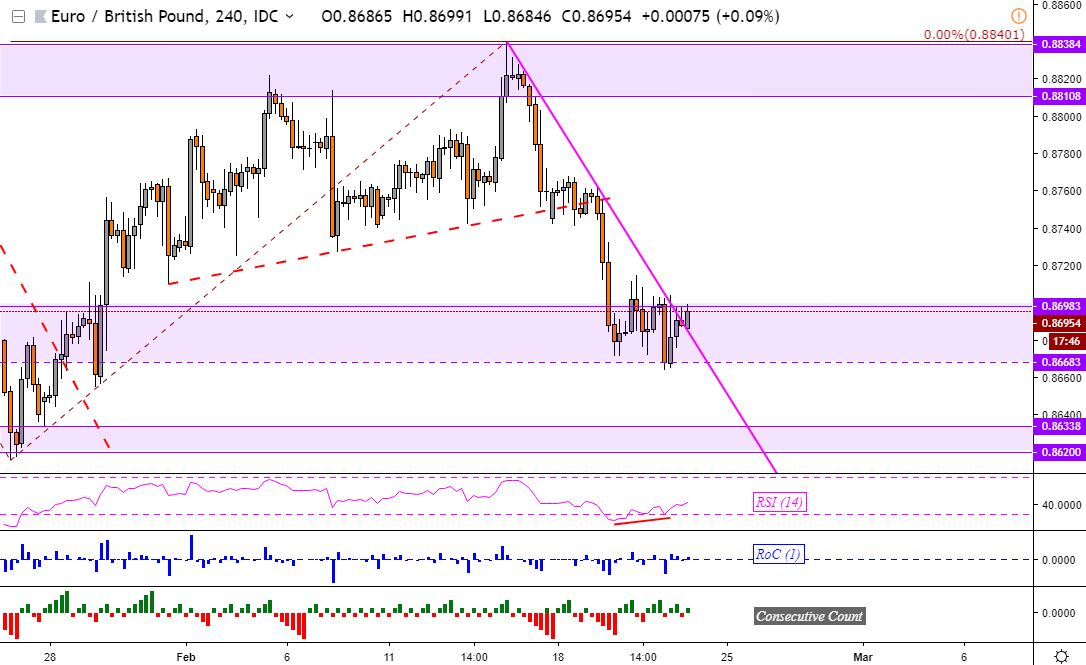
EUR/GBP 4-Hour Chart
Zooming in on the EUR/GBP 4-hour chart shows exactly that. Momentum to the downside stalled after prices tried to breach the outer area of support at 0.86683. Meanwhile, the descending resistance line from about a week ago seems to be on the verge of falling apart. We are already seeing the pair closing above it, but it will have to surpass 0.86983 for a chance to aim back at resistance around 0.88108 – 0.88384.
In the meantime, should prices descend through support and pass January lows, the next area of interest could be the 50% midpoint of the Fibonacci extension at 0.85939. What move EUR/GBP makes soon may determine its trajectory next week. With that in mind, you may follow me on Twitter at @ddubrovskyFX for more timely updates on the currency cross.
**Charts created in TradingView
FX Trading Resources
- Join a free Q&A webinar and have your trading questions answered
- Just getting started? See our beginners’ guide for FX traders
- See our free guide to learn what are the long-term forces Euro prices
- See how the British Pound and Euroare viewed by the trading community at the DailyFX Sentiment Page
--- Written by Daniel Dubrovsky, Junior Currency Analyst for DailyFX.com
To contact Daniel, use the comments section below or @ddubrovskyFX on Twitter


